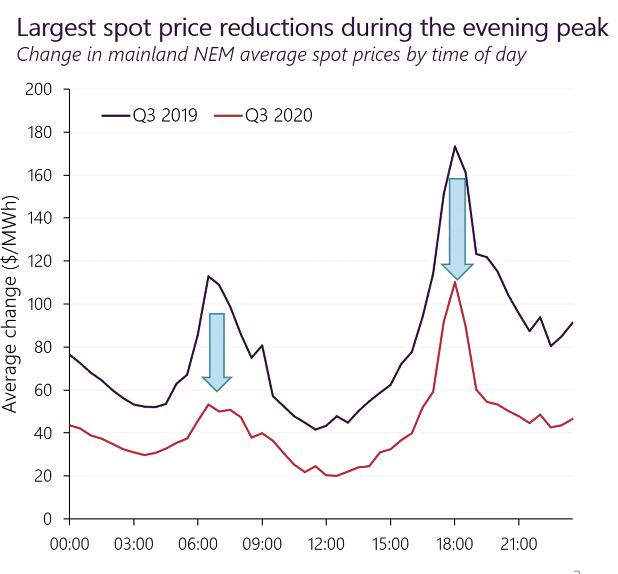
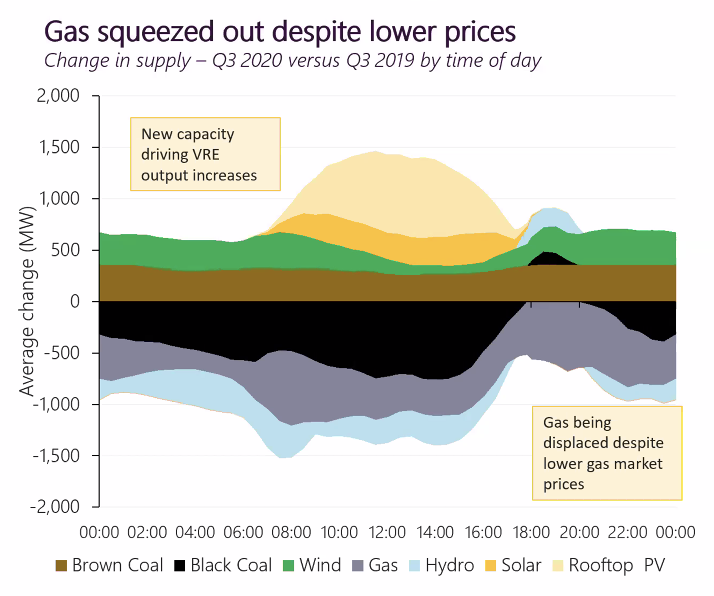
a bit of a complex chart, but basically shows that solar, wind and brown coal pushed out black coal, gas and hydro.
brown coal: there were some long-term outages in Q3 last year
hydro: dry july
gas: surprising given that gas cost has been so low.
brown coal: there were some long-term outages in Q3 last year
hydro: dry july
gas: surprising given that gas cost has been so low.
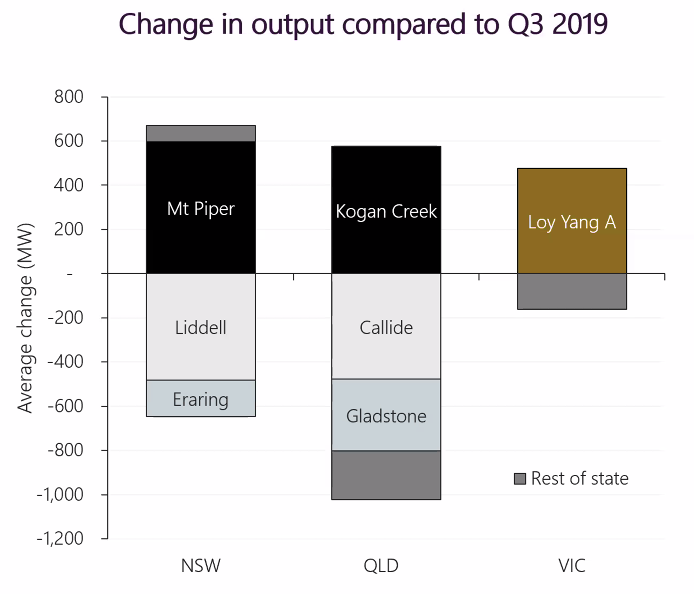
significant shift in contribution from individual coal generators.
most of it is due to outages (planned and unplanned) — but big net reduction in QLD is due to solar (and a bit of gas).
most of it is due to outages (planned and unplanned) — but big net reduction in QLD is due to solar (and a bit of gas).
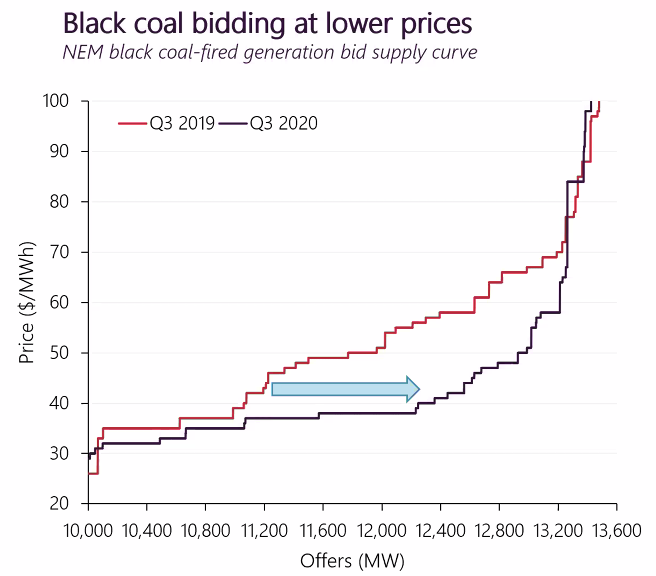
another reasonably complex chart for the uninitiated, but this one shows the black coal fleet has significantly dropped their prices (ie. market bids) since the same period last year.
…but they _still_ sold *fewer* MWh.
(so income will be way down, reducing viability.)
…but they _still_ sold *fewer* MWh.
(so income will be way down, reducing viability.)
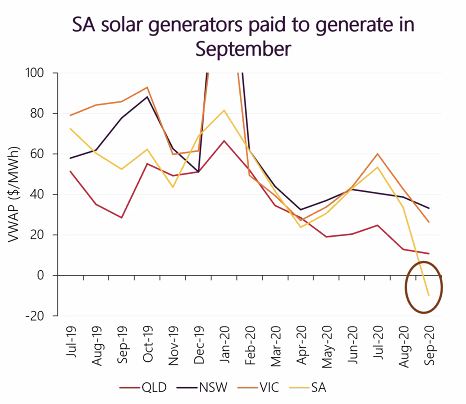
increasing (and self-correlated) solar is driving down market value.
look at that volume weighted price for solar in SA in september… 😬
look at that volume weighted price for solar in SA in september… 😬
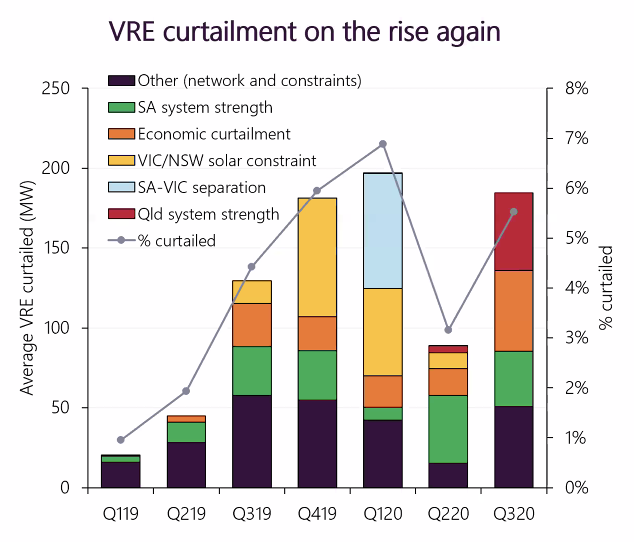
fascinating curtailment information…
growth mainly due to:
• emerging issue of system strength in QLD
• increasing "economic curtailment" (turning off because market price is "too negative")
growth mainly due to:
• emerging issue of system strength in QLD
• increasing "economic curtailment" (turning off because market price is "too negative")
seeing negative pricing more often at the two ends of the NEM (SA & QLD).
(in line with increasing economic curtailment.)
(in line with increasing economic curtailment.)

FCAS (frequency control ancillary services) costs have dropped significantly.
more supply, bidding lower.
more supply, bidding lower.

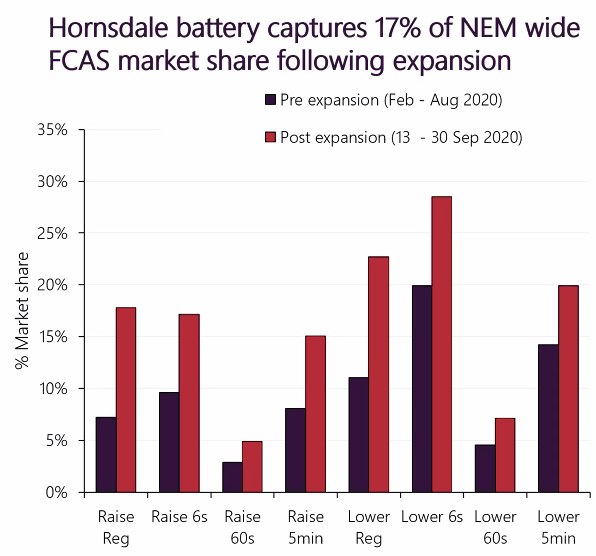
since its recent expansion, the @tesla hornsdale battery has captured 1/6 of the country's FCAS market! 
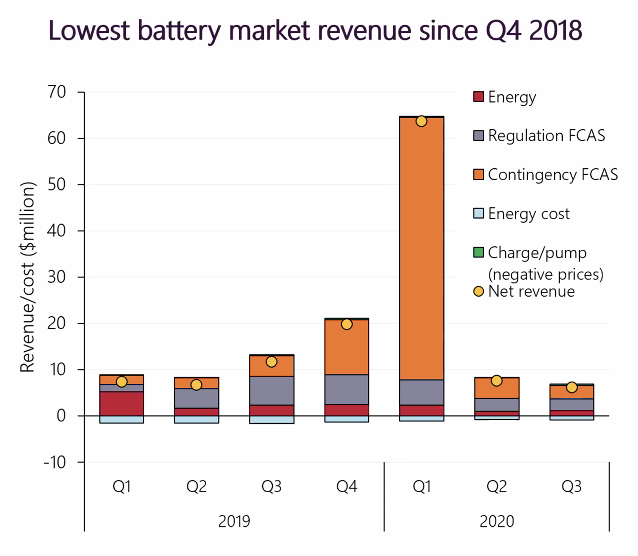
…in line with the lower FCAS prices, revenue for the NEM batteries was weak.
"still not a strong signal for energy arbitrage"
"still not a strong signal for energy arbitrage"
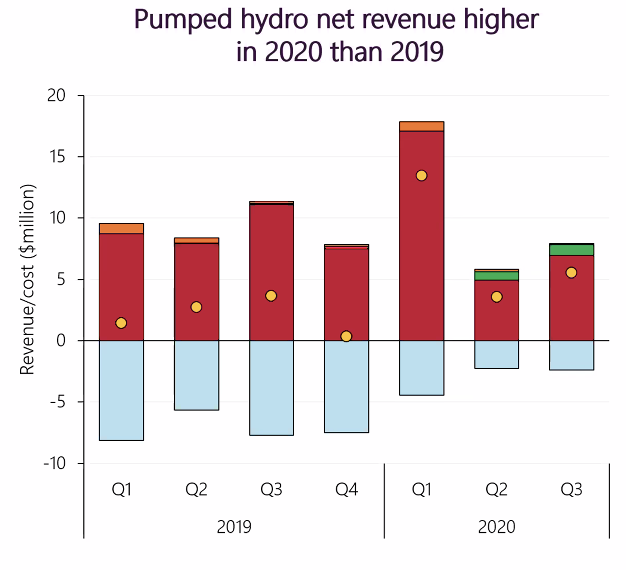
pumped hydro enjoyed a strong Q1, but market signal is weak.
(this is a hugely important point: the market signal for storage in the NEM is pretty weak.)
(this is a hugely important point: the market signal for storage in the NEM is pretty weak.)
lowest gas prices since 2015… no, this has nothing to do with @AngusTaylorMP or the #GasLitRecovery nonsense — driven by international oil/gas market dynamics. 

big thanks to jonathan myrtle and his team at @AEMO_Media for the slides above and @MEIunimelb for hosting.
the QED is a fantastic contribution to energy understanding in australia.
aemo.com.au/energy-systems…
the QED is a fantastic contribution to energy understanding in australia.
aemo.com.au/energy-systems…
• • •
Missing some Tweet in this thread? You can try to
force a refresh


