North Carolina Early Vote (EV) - Full Analysis of Early Vote
THREAD 1/N
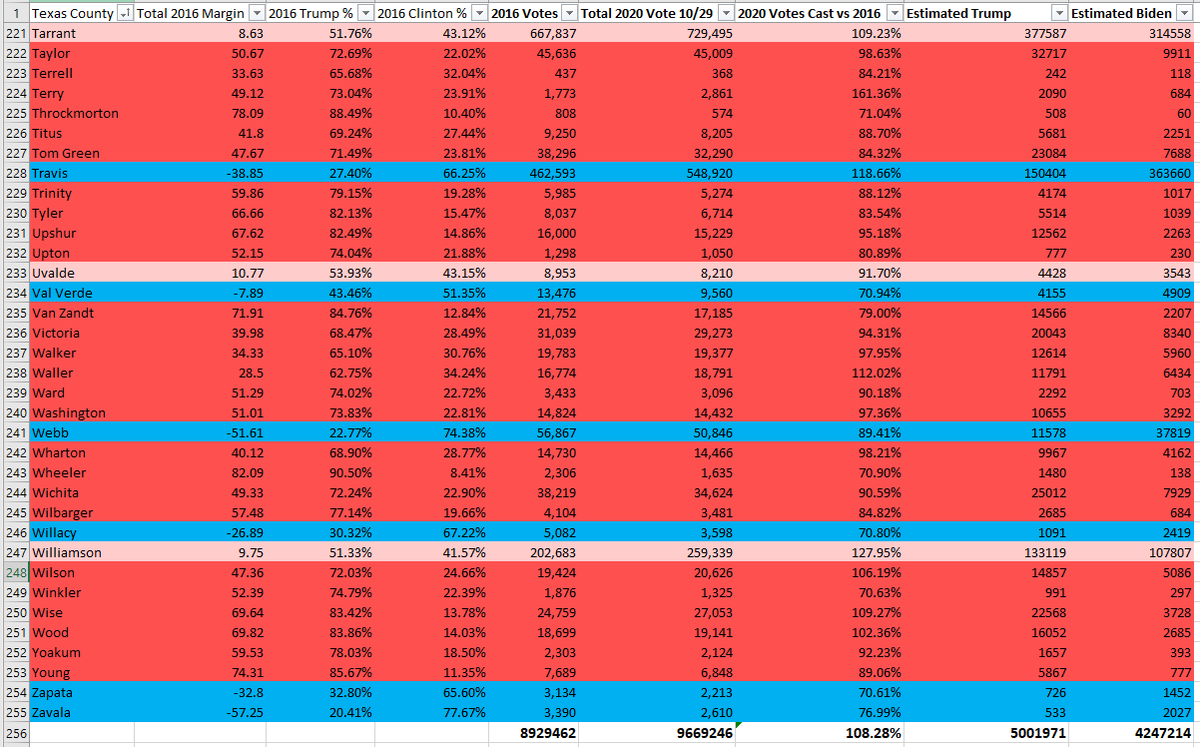
Methodology
* Take all EV per county through 10/30
* Multiply 2016 T or C %
Estimated EV estimate
* Trump 51.4 to Biden 48.6%
* Trump is up 132K votes
* Targetearly.Targetsmart.com = B 47.2% to T 46.2%
1/n
THREAD 1/N
Methodology
* Take all EV per county through 10/30
* Multiply 2016 T or C %
Estimated EV estimate
* Trump 51.4 to Biden 48.6%
* Trump is up 132K votes
* Targetearly.Targetsmart.com = B 47.2% to T 46.2%
1/n
2/n
* 99.54% of the turnout vs. 2016
* Dark Red = Counties Trump win > 10%+ in 2016
* Pink = Trump win 0% < > 10%
* Blue = Clinton win any margin
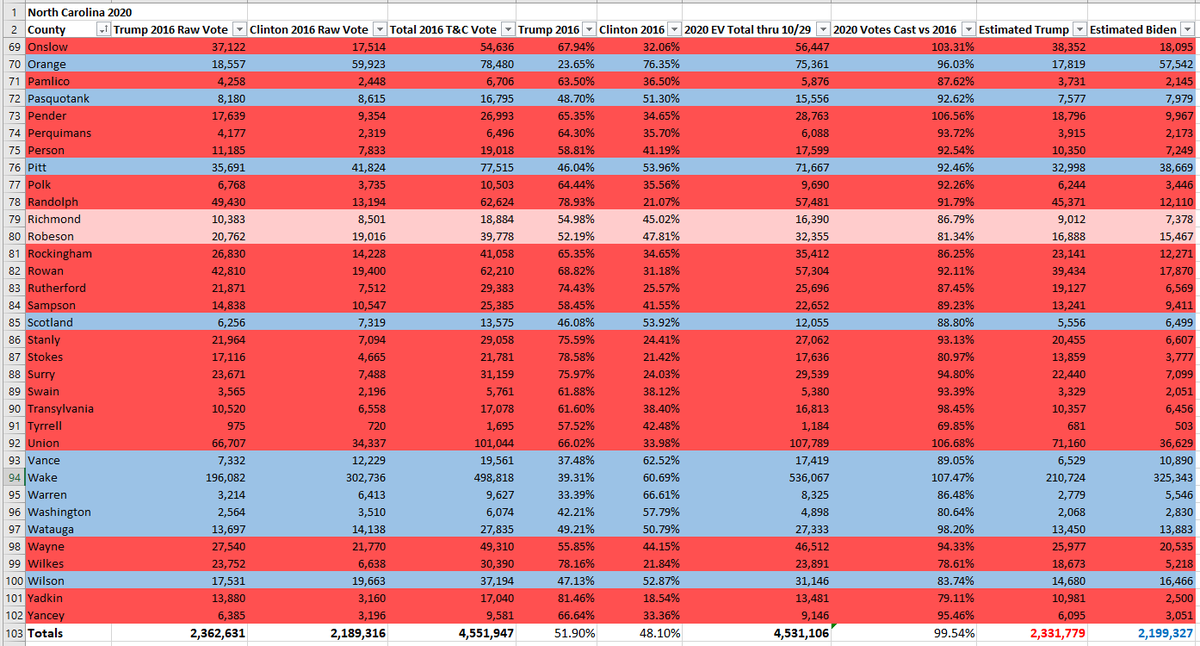
Next we look at
* Sorted by most EV % over 2016, most raw 2020 EV total
* 2016 Clinton, Trump, Battleground Counties
2/n
* 99.54% of the turnout vs. 2016
* Dark Red = Counties Trump win > 10%+ in 2016
* Pink = Trump win 0% < > 10%
* Blue = Clinton win any margin
Next we look at
* Sorted by most EV % over 2016, most raw 2020 EV total
* 2016 Clinton, Trump, Battleground Counties
2/n
3/n
If you sort the table by Biggest % increase over 2016 vote, the Top 38 counties shown are:
9 Clinton Counties
2 Battleground counties
27 Trump Counties
Biden with a small leads in estimated EV 1,566,018 to 1,507,529. 59K lead
3/n
If you sort the table by Biggest % increase over 2016 vote, the Top 38 counties shown are:
9 Clinton Counties
2 Battleground counties
27 Trump Counties
Biden with a small leads in estimated EV 1,566,018 to 1,507,529. 59K lead
3/n

4/n
2016 Battleground counties (T win < 10%) (Pink) are running 94% of 2016 raw vote.
* 10 Total Counties
* 93.95% of the vote in vs 2016
* I'm estimating T+12K 149,049 to 137,394
* This group has the lowest 2020 EV vs 2016 total vote. Likely significant ED vote left.
4/n
2016 Battleground counties (T win < 10%) (Pink) are running 94% of 2016 raw vote.
* 10 Total Counties
* 93.95% of the vote in vs 2016
* I'm estimating T+12K 149,049 to 137,394
* This group has the lowest 2020 EV vs 2016 total vote. Likely significant ED vote left.
4/n
5/n
2016 Clinton Counties are running 102% of 2016 Raw vote. Highest of the 3 groups
* 24 Total Counties
* I'm estimating B + 557K
* Biden 1,400,904 to Trump 843,375
* A lot of vote in already at 102% of 2016.
5/n
2016 Clinton Counties are running 102% of 2016 Raw vote. Highest of the 3 groups
* 24 Total Counties
* I'm estimating B + 557K
* Biden 1,400,904 to Trump 843,375
* A lot of vote in already at 102% of 2016.
5/n

6/end
2016 Trump counties running 97.8% of 2016.
* 66 counties Trump > 10% in 2016
* I'm estimating T + 678K
* Trump 1,339,356 Biden 661,028
* Possibly more potential for ED voting in these counties...
PREDICTION? Trump +3
6/end
2016 Trump counties running 97.8% of 2016.
* 66 counties Trump > 10% in 2016
* I'm estimating T + 678K
* Trump 1,339,356 Biden 661,028
* Possibly more potential for ED voting in these counties...
PREDICTION? Trump +3
6/end

• • •
Missing some Tweet in this thread? You can try to
force a refresh