As someone who has been trying in my own way to push back the darkness in regards to how our media and public health officials have used a pandemic to seize power and control...

What I witnessed last night in regards to our election was openly and brazenly evil

1/n
While I am not shocked, I am discouraged that it appears the deep state, media and public officials will disregard any sense of decency, in any domain, to win power and control over all of our lives.

The entire night was example after example, and its continued overnight

2/n
The media refusing to call any state for Trump unless it was "100% sure," while calling any state for Biden the second the polls closed. No attempt to avoid the appearance of impropriety. VA, AZ called early, while every Trump battleground called super late or not at all.

3/n
Keeping states off the board to prevent the appearance of a Trump win. Giving multiple states with huge Trump leads time to wait until the middle of the night to find tranche's of ballots that go 90-95% Biden.

4/n
People will say "conspiracy theory" but my question to them is "have you been awake the past 8 months?" Have you not seen a Presidential election before yesterday? Have you not witnessed the amount of openly brazen Tech/media censorship & cancel culture we now operate under?

5/n
The pathway to a win was right before our eyes. We went to bed with what appeared to be a 294-245 win. That vanished in the blink of a 4am van full of Biden ballots.

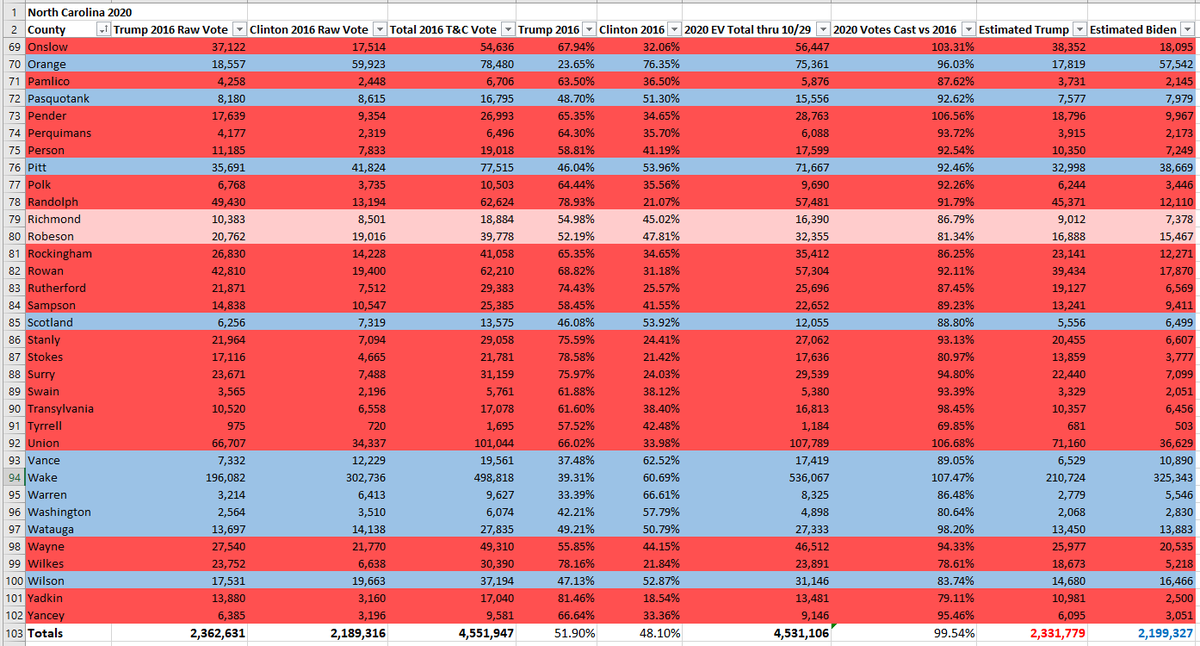
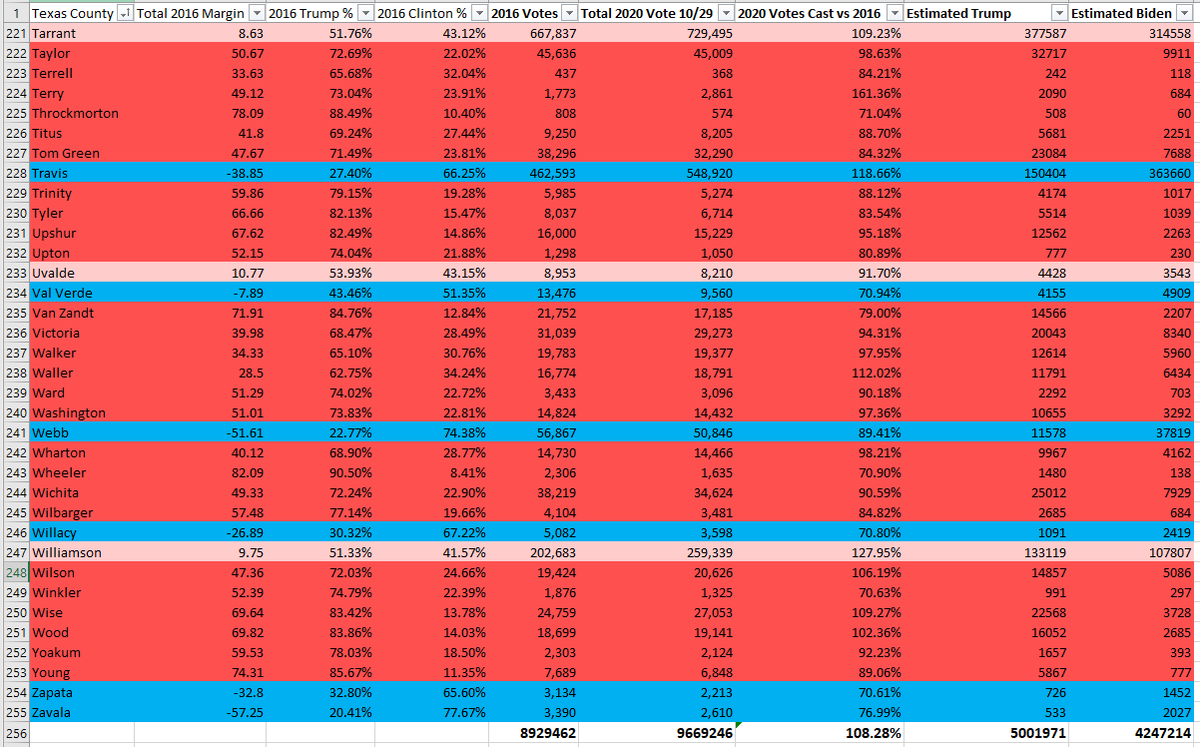
I would say the pathway this morning is GA, NC, PA, and one of WI, MI, AZ, or NV

But that doesn't matter.

6/n
What's worse is that despite the media/deep state attempt to suppress the vote with the worst God awful polling you've ever seen, Trump won state after state last night, and was on the precipice of a stunning win.

But the deep state wasn't having it. And here we are.

7/end

• • •

Missing some Tweet in this thread? You can try to force a refresh
 

Keep Current with therealarod1984

therealarod1984 Profile picture

Stay in touch and get notified when new unrolls are available from this author!

Read all threads

This Thread may be Removed Anytime!

PDF

Twitter may remove this content at anytime! Save it as PDF for later use!

Try unrolling a thread yourself!

how to unroll video
  1. Follow @ThreadReaderApp to mention us!

  2. From a Twitter thread mention us with a keyword "unroll"
@threadreaderapp unroll

Practice here first or read more on our help page!

More from @therealarod1984

5 Nov
1/n

I'll just keep repeating - Unless there's a hand recount & voter registration confirmation in the 7 states in question, this nation will be in chaos whoever the next President is.

Its not a numbers game anymore..

Thread - 1/n
2/n

These 7 states have been counting ballots for 54 hours. The entire process is completely tainted. An insufficient numbers of American trust the process

Any "results" and number crunching occurring against any of these ballots is pointless.

2/n
3/end

2000 was resolved by hand recount in FL. Voter reg confirmation needs to be included in 2020. It will take weeks to do this - Fine.

Otherwise the next President will lead a Banana Republic w half the nation in open revolt.

It's too late for Tuesday ballot counting
Read 4 tweets
2 Nov
North Carolina Early Vote (EV) - Full Analysis of Early Vote

THREAD 1/N

Methodology
* Take all EV per county through 10/30
* Multiply 2016 T or C %

Estimated EV estimate
* Trump 51.4 to Biden 48.6%
* Trump is up 132K votes
* Targetearly.Targetsmart.com = B 47.2% to T 46.2%

1/n Image
2/n

* 99.54% of the turnout vs. 2016
* Dark Red = Counties Trump win > 10%+ in 2016
* Pink = Trump win 0% < > 10%
* Blue = Clinton win any margin

Next we look at
* Sorted by most EV % over 2016, most raw 2020 EV total
* 2016 Clinton, Trump, Battleground Counties

2/n
3/n

If you sort the table by Biggest % increase over 2016 vote, the Top 38 counties shown are:

9 Clinton Counties
2 Battleground counties
27 Trump Counties

Biden with a small leads in estimated EV 1,566,018 to 1,507,529. 59K lead

3/n Image
Read 6 tweets
31 Oct
Texas Early Vote (EV) - Full Analysis of Early Vote

THREAD 1/N

Methodology
* Take all EV per county through 10/30
* Multiply 2016 T or C %

Estimated EV estimate
* Trump 51.7% to Biden 43.9%
* Trump is up 755K votes
* Targetearly.Targetsmart.com = 51.3% to 38.9%

1/n
2/n

* 108.28% of the turnout vs. 2016
* Dark Red = Counties Trump win > 20%+ in 2016
* Pink = Trump win 0% < > 20%
* Blue = Clinton win any margin

Next we look at
* Sorted by most EV % over 2016, most raw 2020 EV total
* 2016 Clinton, Trump, Battleground Counties

2/n
3/n

If you sort the table by Biggest % increase over 2016 vote, the Top 38 counties shown are:

8 Clinton Counties
4 Battleground counties
26 Trump Counties

Trump leads in estimated EV 3,010,137 to 2,886,586. 124K lead

3/n
Read 7 tweets
14 Oct
Scott Atlas: Prolonged lockdowns a Complete Disaster

* Working class & low income people destroyed
* 46% of cancers not diagnosed
* 50% chemo appts missed
* 50% missed immunizations
* 200K missed cases of abuse
* 25% of young people considering suicide

a.msn.com/05/en-us/BB19Z…
Found a better link
Here's a link that is working since MSN videos aren't playing right now.

Read 5 tweets
13 Oct
10/12 Texas Border Update - THREAD

* Counties that border Mexico, 9% of the population, accounted for almost 27% of TX fatalities between Jun & now
* 7 of Top 23 counties in fatalities are border counties (Orange)
* 5 of Top 12
* Border Deaths per million - crazy high

1/n
Here is the breakdown for all the Texas Border counties. At the bottom you'll notice that the Border accounts for 9.01% of Texas' population. Yet for the entire pandemic, the border accounts for 23.41% of the fatalities. This is up half a point from my last report in Sept

2/n
For the Entire Pandemic, you can see on this chart that fatalities on the border were running right at population through mid June. July saw a surge that raised the proportion to 24% by the end of August, and has remained there, decreasing slightly in recent weeks

3/n
Read 7 tweets
12 Oct
10/11 TX C-19 Hospital Census: Capacity

* Census - 3622 - up 430 beds Week over Week (WoW)
* % Beds used by C19 - 5.56%
* ICU C19 - 1142, up 71 beds WoW
* Hospital bed capacity - record 65,151
* C19 % beds used (orange) diverging from C19 census (blue)

1/n

#RationalGround Image
TX Hospital Bed Capacity - Up Bigly

* 10/11 Bed Capacity - 65,151 (Image 1)
* Highest since June 5
* Up 7,084 beds from last week
* Meanwhile free beds are down 41 WoW (Image 2), meaning 7K more patients than last week.
* Delayed Care / Elective surgery increasing rapidly

2/n ImageImage
10/11 ICU vs General Bed Census

ICU still basically flat with a small rise the past 3 days. Meanwhile General census is up over 300 in the past 8 days alone.

With more electives and delayed care being admitted, all being PCR tested = rise in census numbers.

3/n Image
Read 6 tweets

Did Thread Reader help you today?

Support us! We are indie developers!


This site is made by just two indie developers on a laptop doing marketing, support and development! Read more about the story.

Become a Premium Member ($3/month or $30/year) and get exclusive features!

Become Premium

Too expensive? Make a small donation by buying us coffee ($5) or help with server cost ($10)

Donate via Paypal Become our Patreon

Thank you for your support!

Follow Us on Twitter!