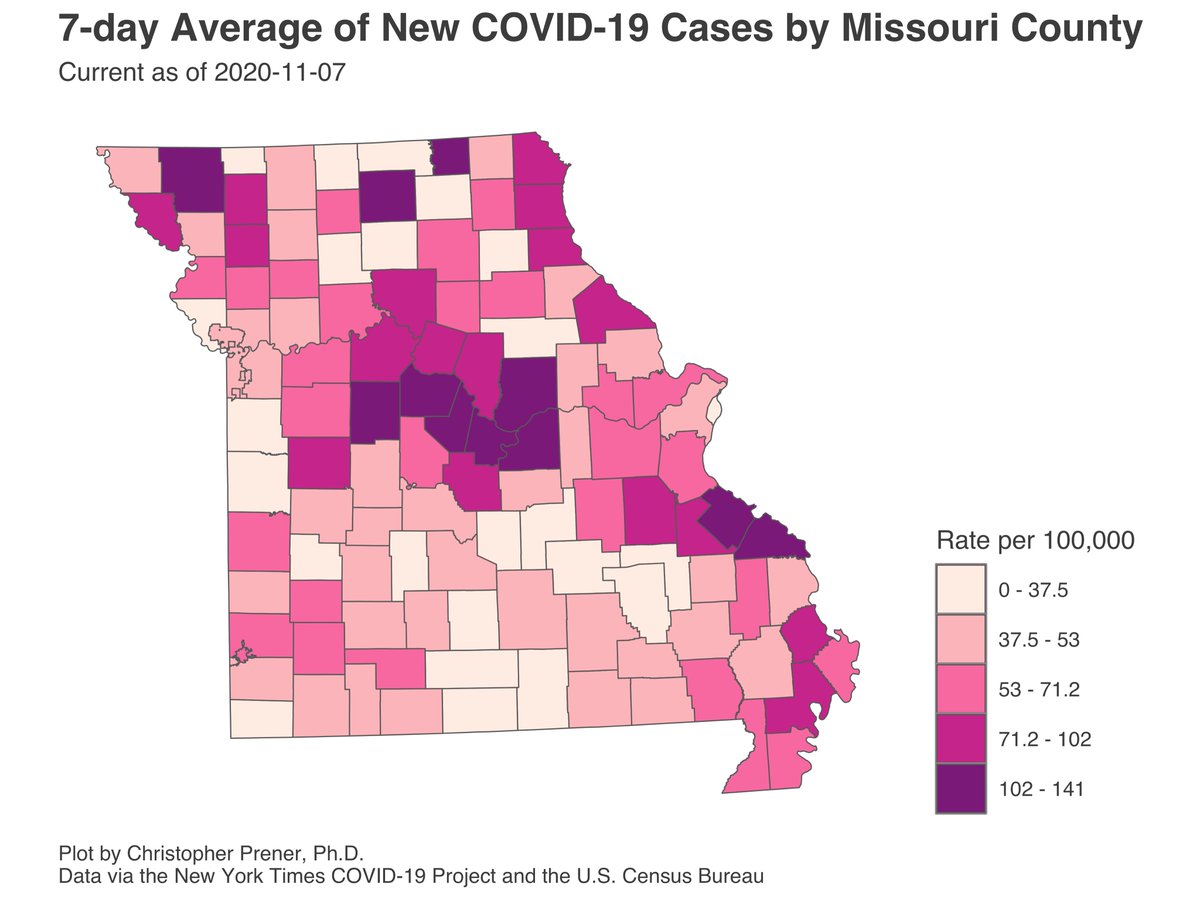
My #Missouri #COVID19 tracking site has been fully updated for Saturday, 11/7 - slu-opengis.github.io/covid_daily_vi….

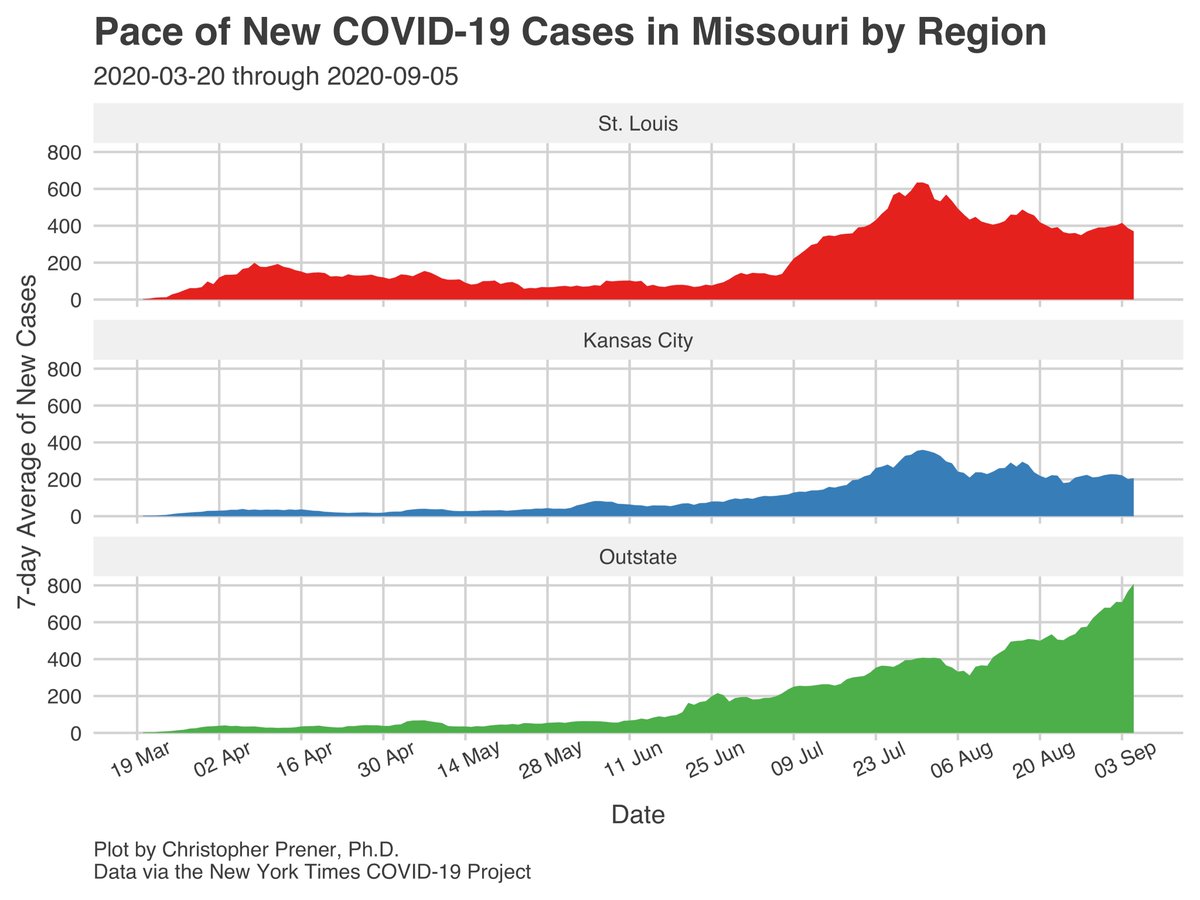
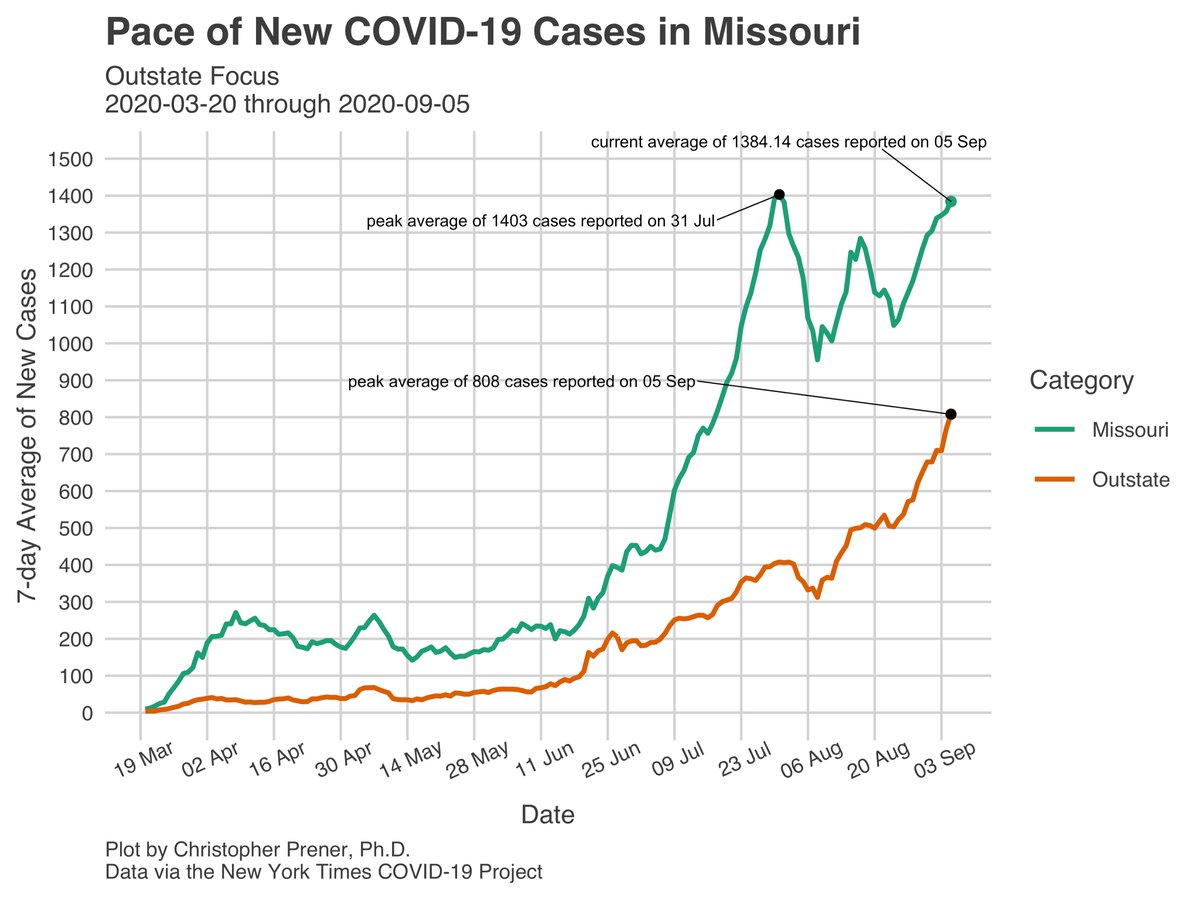
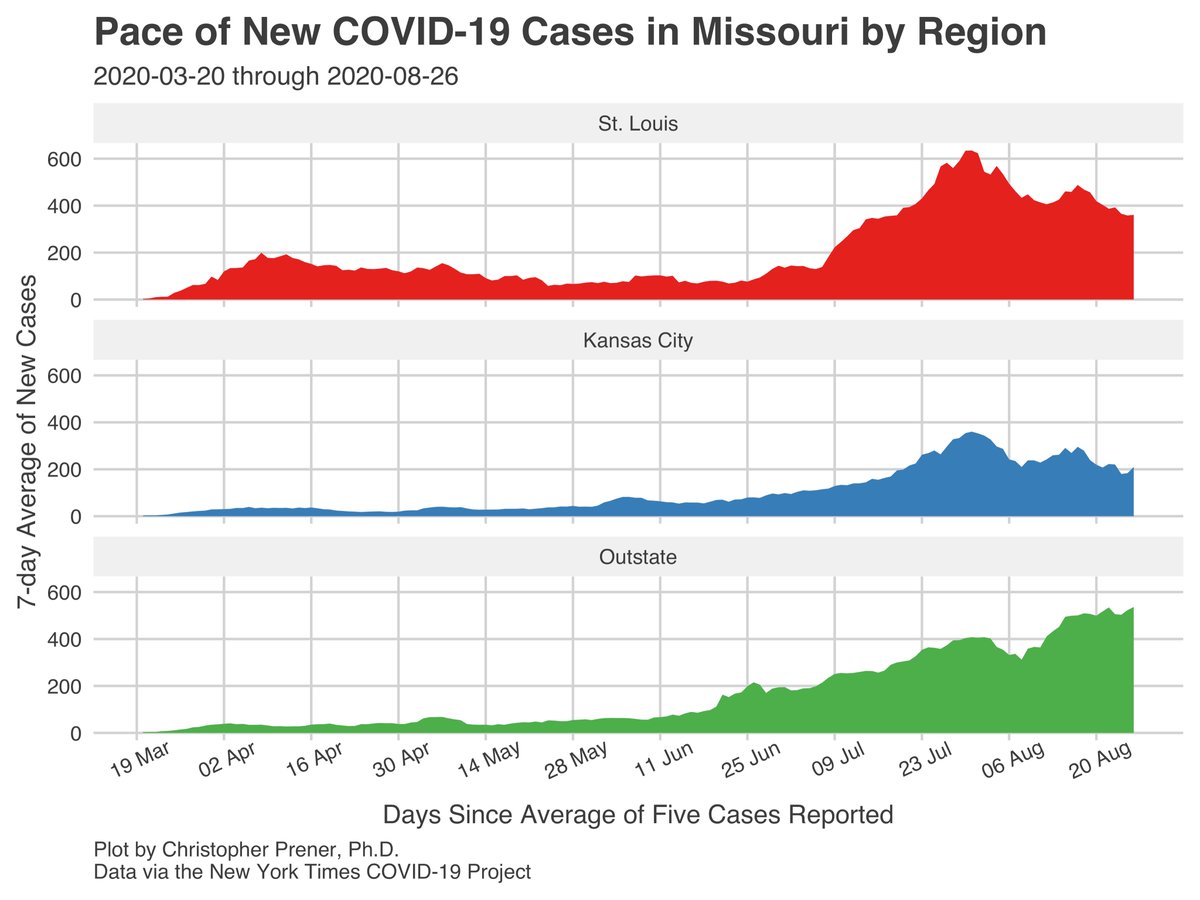
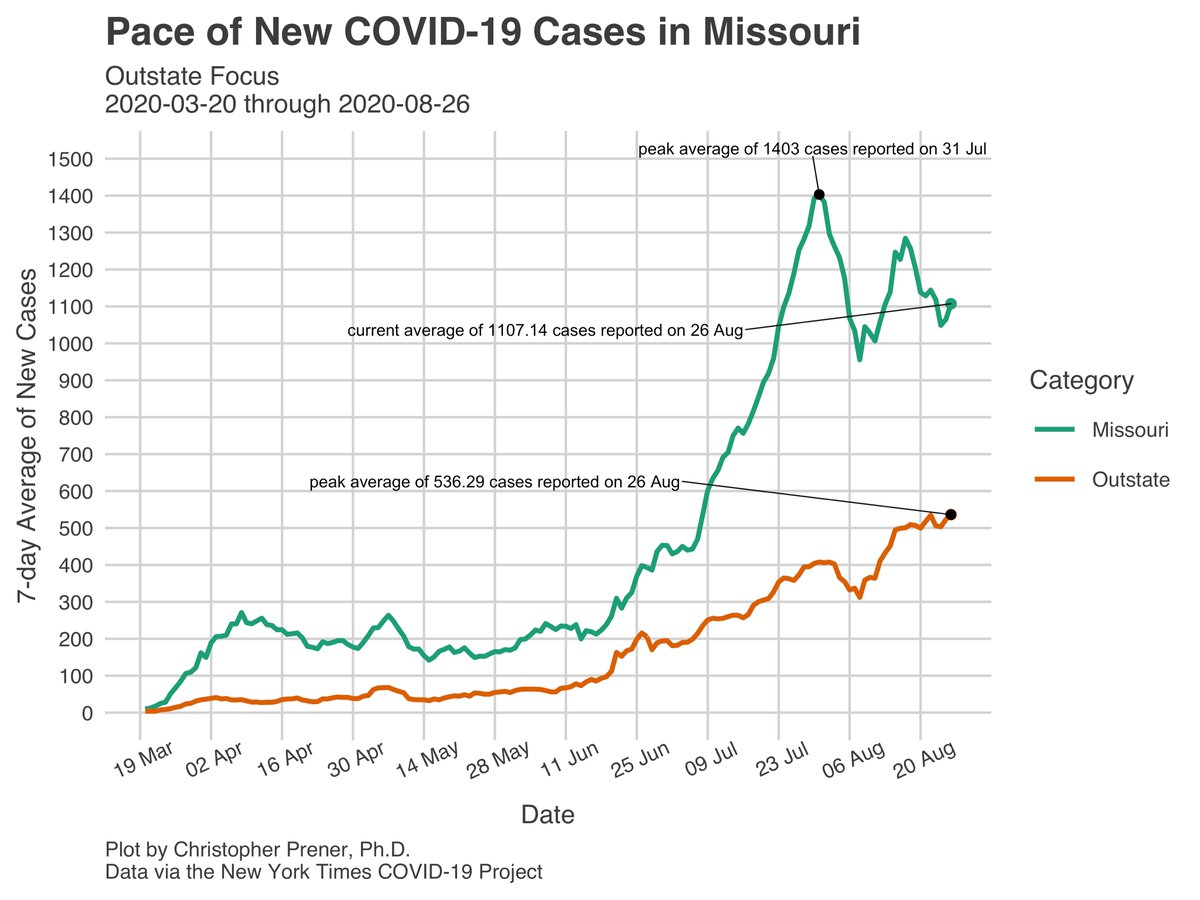
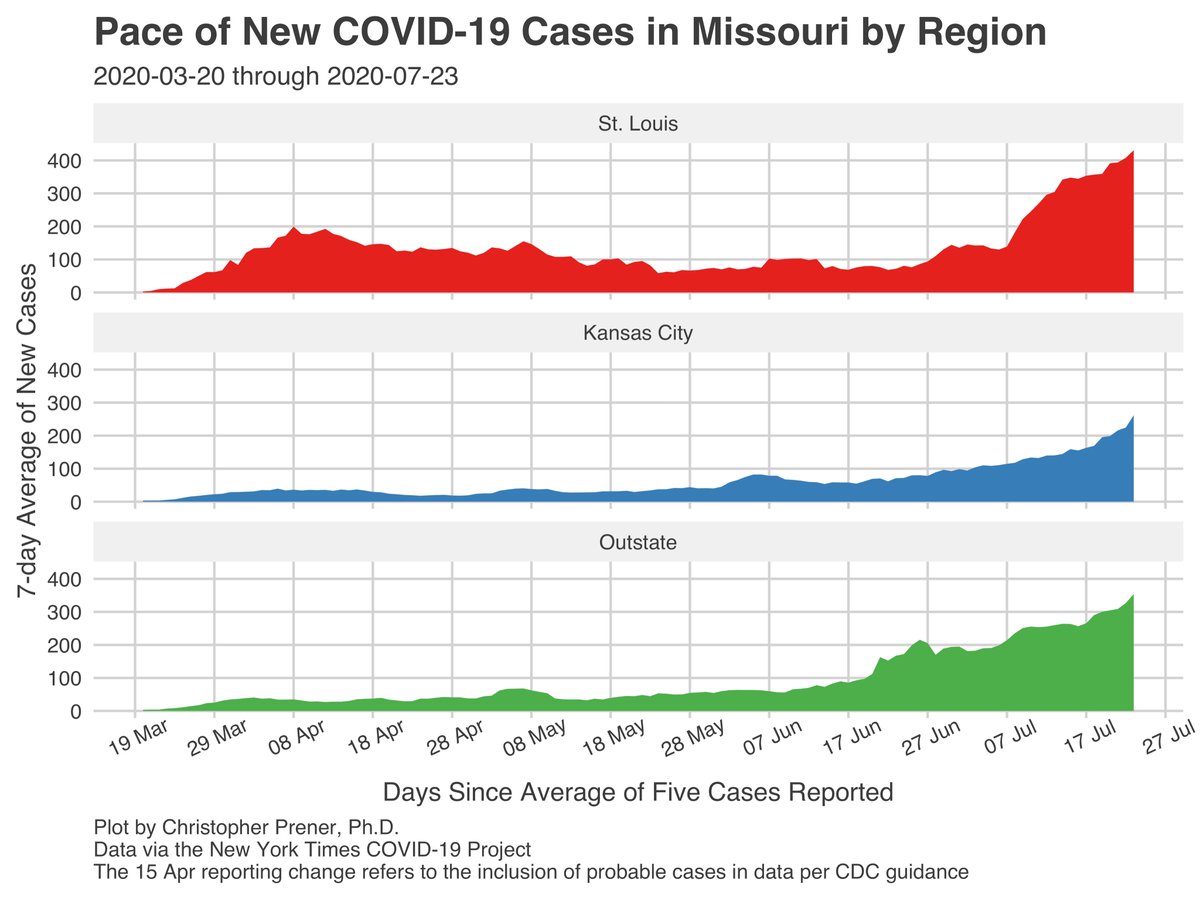
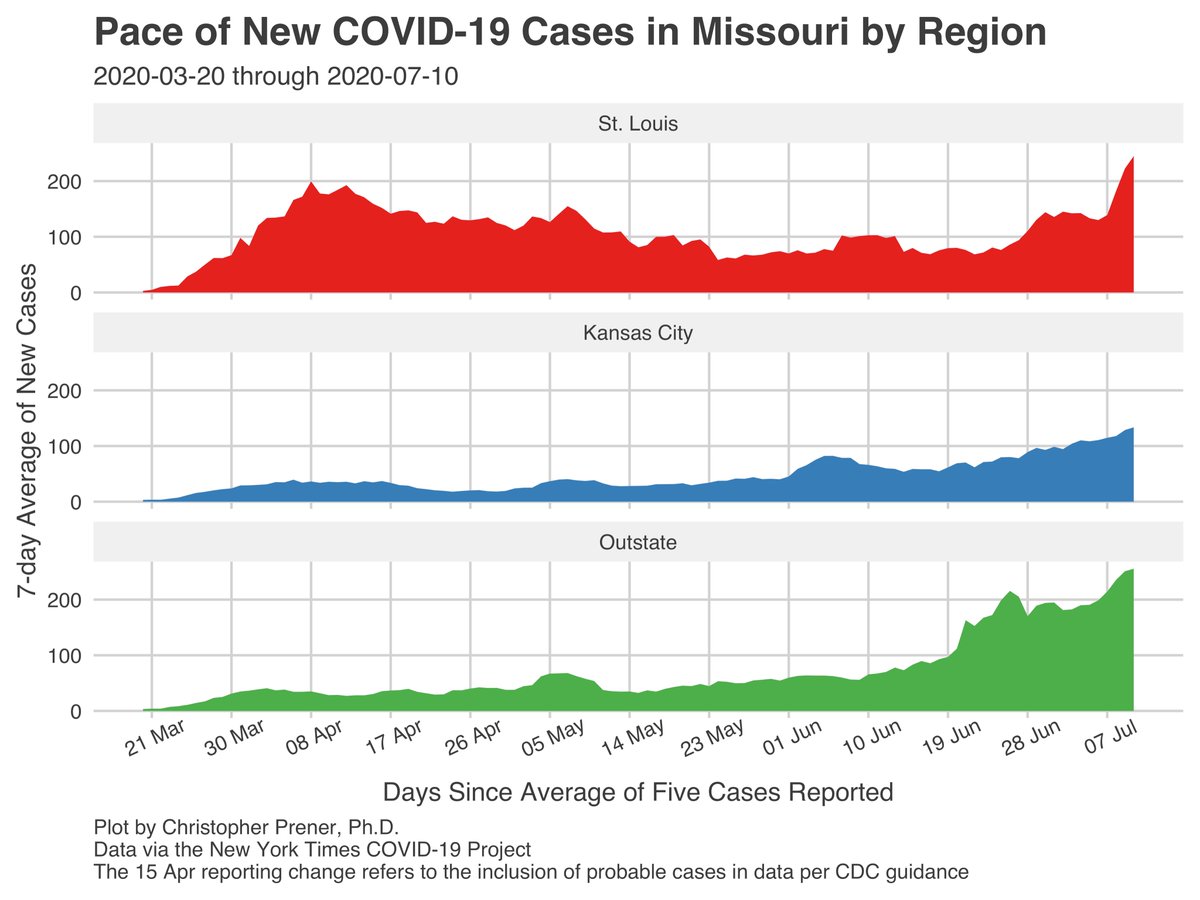
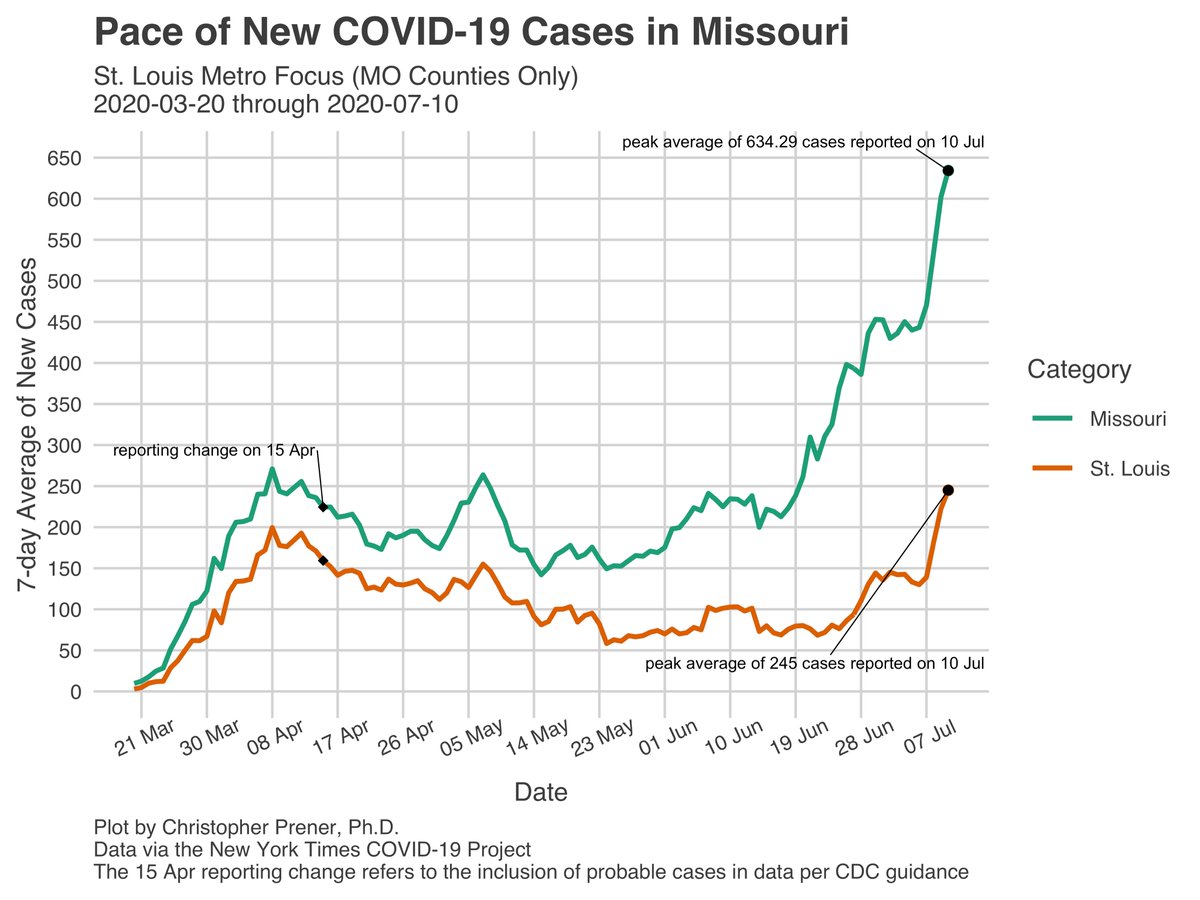
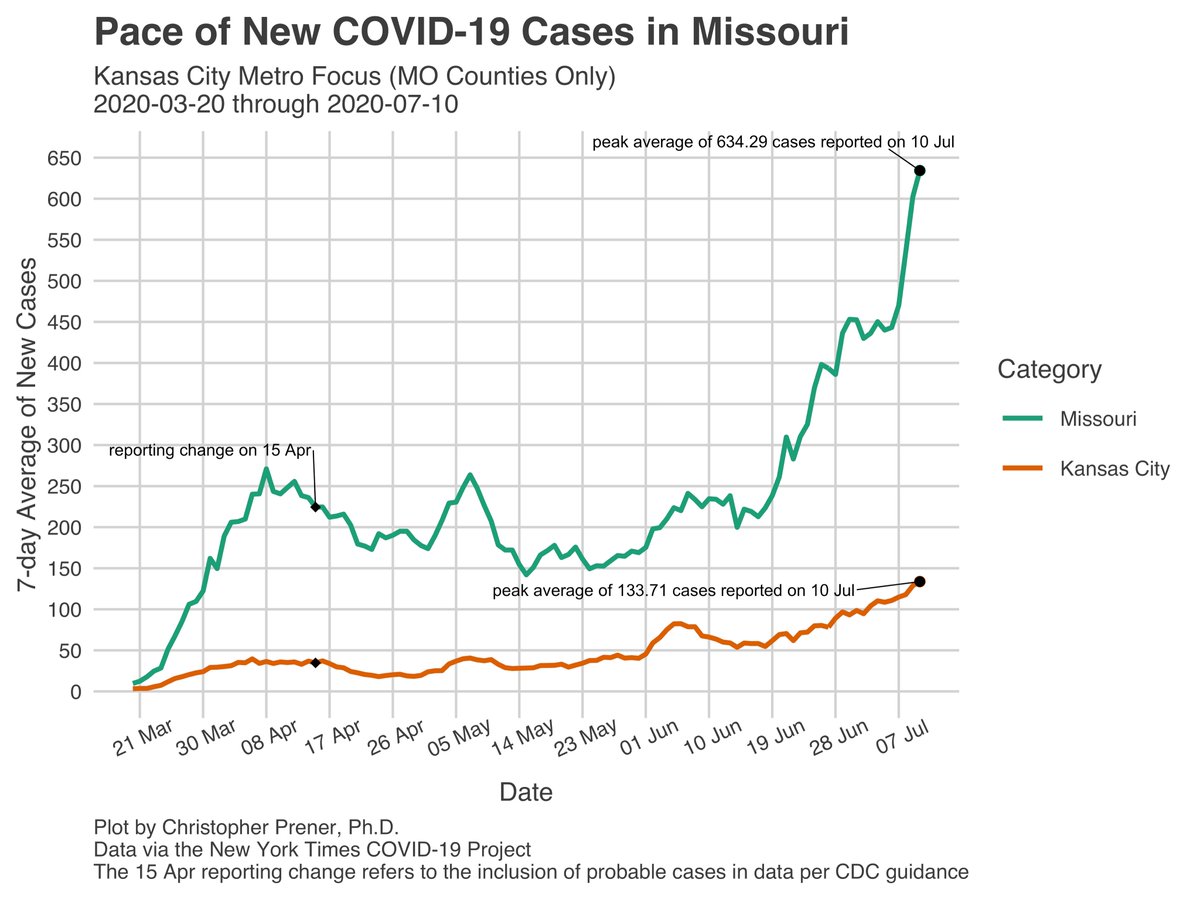
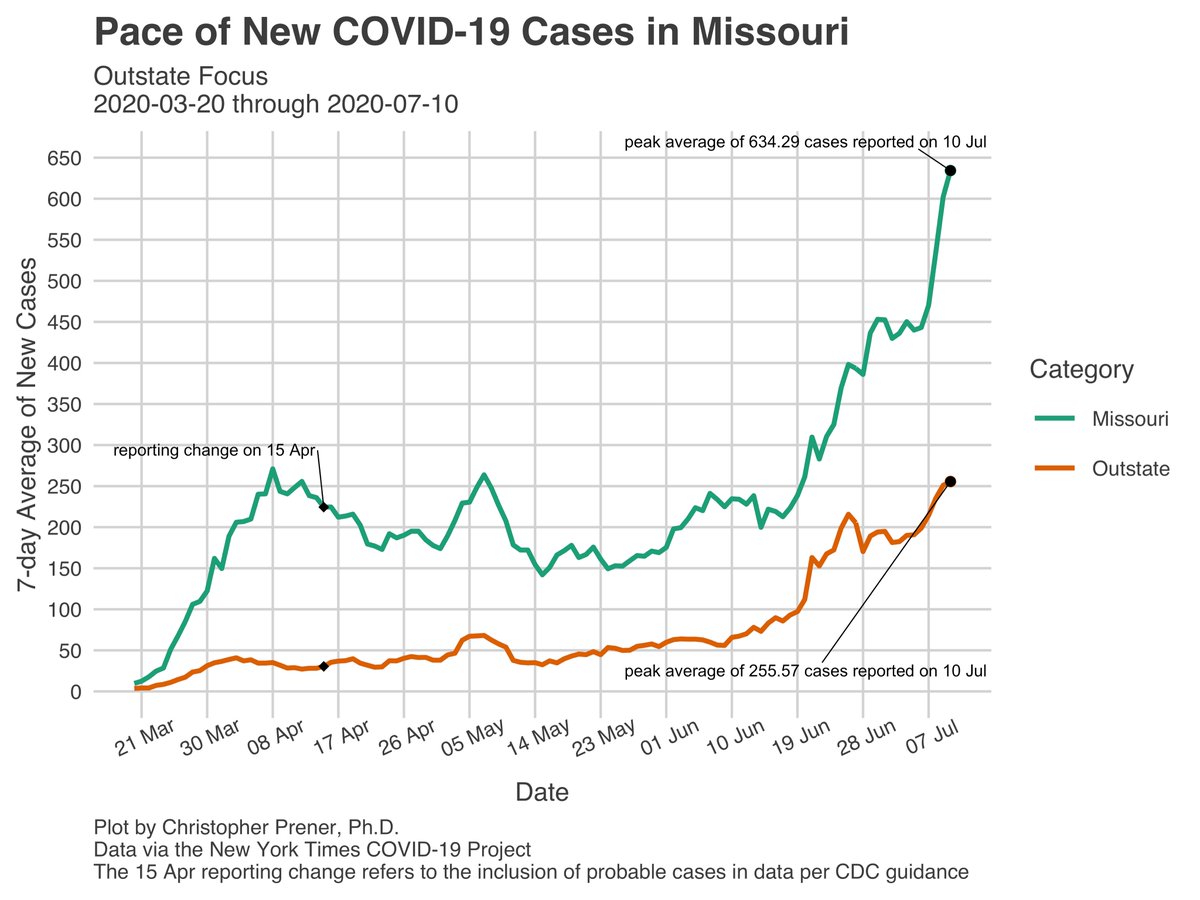
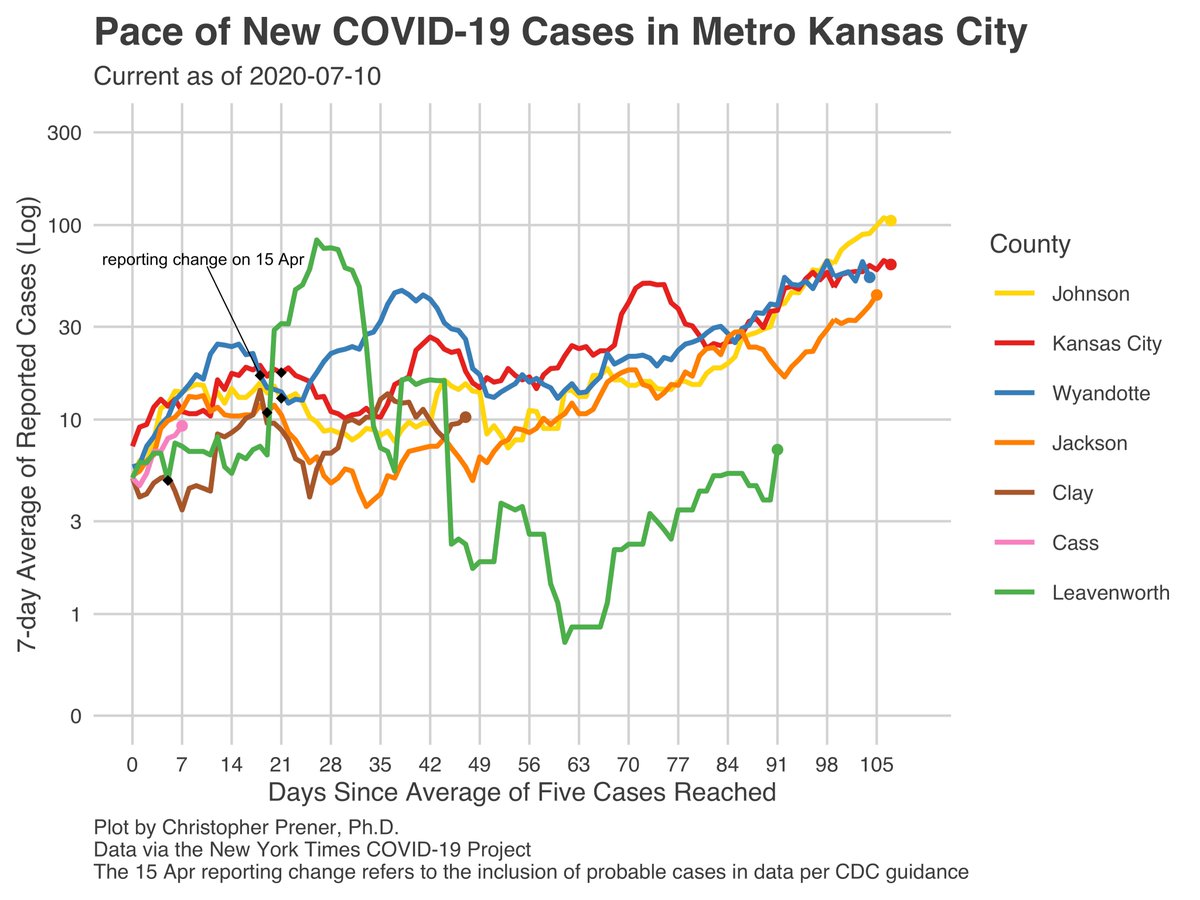
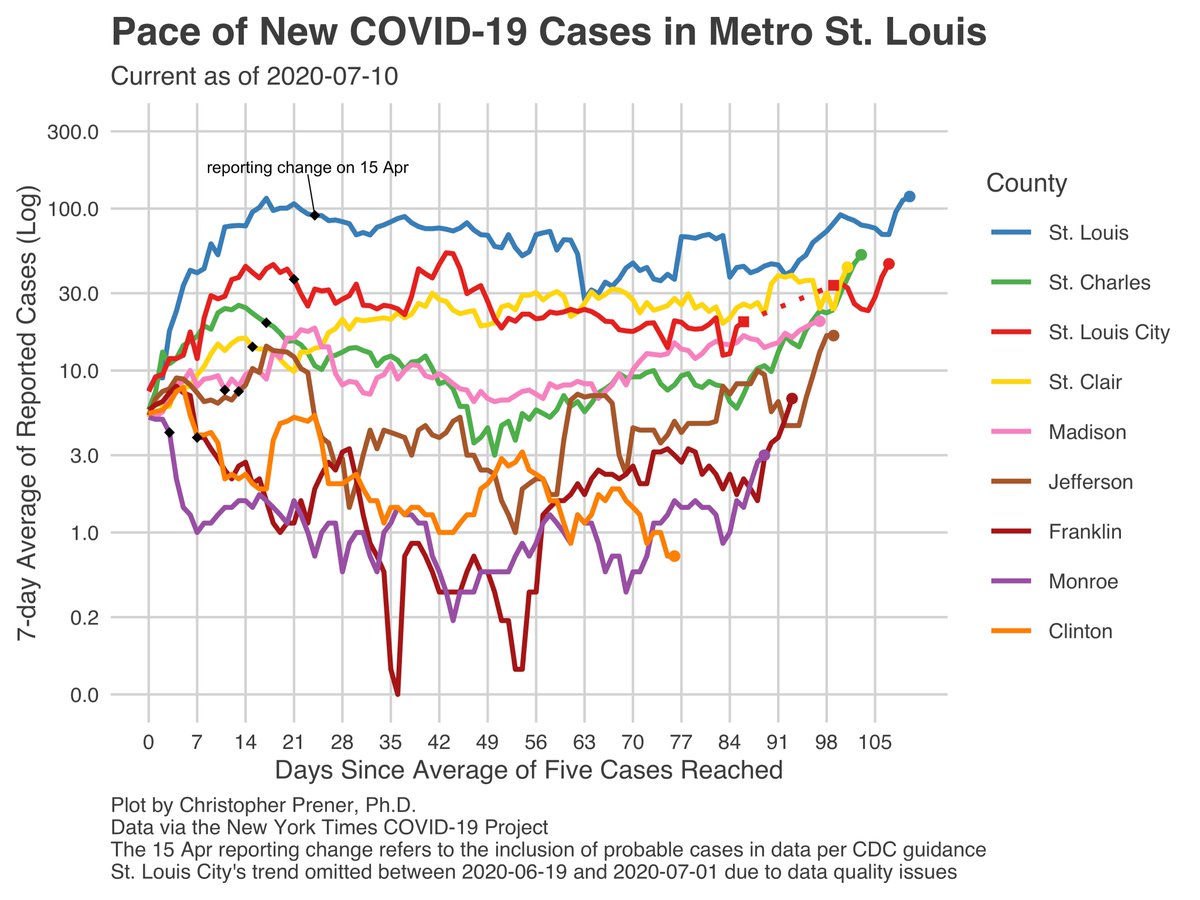
It feels like we’ve hit a tipping point now - we’re now adding over 3000 cases per day, on average, statewide. Our regional averages are each at all-time highs. 1/6 ImageImageImageImage
We don’t know how exactly how this compares to the spring ☝️, because testing limits affected our ability to identify cases. But take a look at our hospitalizations in #StLouis if you want a sense of how bad things are right now 👇. We. Must. Act. Decisively. Now. 2/6 ImageImage
I’ve made another round of updates to the ZIP code maps for #StLouis to include Lincoln County on both the case and 14-day average maps. Warren County and Metro East will be added to the 14-day avg. maps next Friday. Lincoln County will follow later. 3/6 slu-opengis.github.io/covid_daily_vi… ImageImage
If you missed it, please check out the latest edition of “River City Data.” It has an update on plans for new data products, an overview of where we're at with COVID, some thoughts on political polling, and my interview with @stltoday's @michelemunz. 4/6 chrisprener.substack.com/p/weekly-covid…
Tonight’s @StLouisCovid memorial is for Beverly Hobaugh. She was active in her church & community, and recorded a warning from the hospital about COVID that is on her memorial page. Everyone should watch it. Ms. Hobaugh passed away in September at 59. 5/6 stlouiscovidmemorial.com/beverly-hobaug…
If you want to check on regional trends, disparities data, nursing home outbreaks, and hospitalization metrics, please check the website - slu-opengis.github.io/covid_daily_vi….

Next 🧵 will be Tuesday, 11/10.

6/6
Please note the correction to the ZIP code tweet above 👆👆

• • •

Missing some Tweet in this thread? You can try to force a refresh
 

Keep Current with Chris Prener

Chris Prener Profile picture

Stay in touch and get notified when new unrolls are available from this author!

Read all threads

This Thread may be Removed Anytime!

PDF

Twitter may remove this content at anytime! Save it as PDF for later use!

Try unrolling a thread yourself!

how to unroll video
  1. Follow @ThreadReaderApp to mention us!

  2. From a Twitter thread mention us with a keyword "unroll"
@threadreaderapp unroll

Practice here first or read more on our help page!

More from @chrisprener

9 Nov
Three thoughts.

First, take a look at hospitalizations right now in the #StLouis area. We're back to roughly where things stood in April in terms of total numbers of in-patients, and we're adding new patients at a faster pace than at any point prior during the pandemic. 1/6 ImageImage
Second, the irony here is that there are areas of MO - especially Mid-Missouri's two metros (Columbia and Jefferson City) - that have far, far higher rates of new cases. 2/6 Image
Even within the #StLouis metro, Franklin, Jefferson, and St. Charles counties all have per capita 7-day averages of new cases that are similar or exceed what the County is experiencing right now. This is why we need *statewide* and *regional* interventions. 3/6 ImageImage
Read 6 tweets
7 Nov
My #Missouri #COVID19 tracking site has been fully updated for Friday, 11/6 - slu-opengis.github.io/covid_daily_vi….

Our 7-day averages continue to climb to all-time highs statewide and in all three regions; all of our alarm bells should be ringing loudly right now. 1/5 ImageImageImageImage
I now have significantly expanded ZIP code mapping for the St. Louis area. Lincoln and Franklin counties are the only metro counties missing, but will be added soon! I should have 14-day averages for Metro East and Warren County next Friday. 2/5 slu-opengis.github.io/covid_daily_vi… Image
I’ve also published the latest edition of “River City Data” this evening. It has an update on plans for new data products, an overview of where we're at with COVID, some thoughts on political polling, and my interview with @stltoday's @michelemunz. 3/5 chrisprener.substack.com/p/weekly-covid…
Read 5 tweets
6 Sep
My #Missouri #COVID19 tracking site has been fully updated for Sunday, 9/6 - slu-opengis.github.io/covid_daily_vi….

The statewide 7-day average continued upward, sitting about ~20 cases per day on average below our peak value in July. This increase came entirely from the “outstate” trend. 1/5
In contrast to “outstate,” which continues to climb, the trends for #StLouis are falling and they are steady in the #KansasCity meso region ☝️. This is great news for those areas considering the large # of new cases yesterday, but deeply concerning for “outstate” hotspots. 2/5
Those hotspots are primarily centered on the Columbia, Springfield, and Joplin metro areas as well as a smattering of counties in northern (esp. Marion and Nodaway) and southeastern MO (esp. St. Francois, not shown). 3/5
Read 5 tweets
27 Aug
This is my #Missouri #COVID19 evening update 🧵 for Thursday, 8/27. My website has been fully updated - slu-opengis.github.io/covid_daily_vi….

The 7-day average of new cases statewide ticked back up yesterday, with corresponding increases in #KansasCity and in the "outstate" region. 1/16
Outstate is back to posting highs relative to past report days ☝️, which now makes up 48.4% of our statewide 7-day average. Only #StLouis continues to show steady improvements. 2/16
The area around Springfield is a big part of the outstate trend. Greene County is averaging 80 new cases per day on average right now, and the Springfield metro is averaging around 100, though 7-day averages have dropped in surrounding counties. 3/16
Read 16 tweets
25 Jul
My #Missouri #COVID19 tracking site has been fully updated for Friday, 7/24 - slu-opengis.github.io/covid_daily_vi….

The 7-day averages of new cases statewide and in the meso regions all reached new highs yet again yesterday. 1/6
This does not include the ~1350 new cases reported today 👆, which will continue drive these trends upward. 2/6
There are two new additions to the website that I want to announce.

First, Nodaway County has been added to the northern MO plots, and Marion will be added tomorrow. Both are adding about 4 new cases per day on average, the highest right now in northern MO. 3/6
Read 6 tweets
11 Jul
My #Missouri #COVID19 tracking site has been fully updated for Saturday, 7/11 - slu-opengis.github.io/covid_daily_vi….

The 7-day averages of new cases reached new highs again yesterday in each of the three meta “regions” of Missouri I plot 👇. 1/5
However, when you interpret these trends, please be cognizant of the caveats I posted yesterday in the third tweet of my non-thread thread. 2/5
Also of note - the 7-day averages of new cases that I pointed out yesterday in #StLouis and #KansasCity continued to climb in the latest data update. 3/5
Read 5 tweets

Did Thread Reader help you today?

Support us! We are indie developers!


This site is made by just two indie developers on a laptop doing marketing, support and development! Read more about the story.

Become a Premium Member ($3/month or $30/year) and get exclusive features!

Become Premium

Too expensive? Make a small donation by buying us coffee ($5) or help with server cost ($10)

Donate via Paypal Become our Patreon

Thank you for your support!

Follow Us on Twitter!