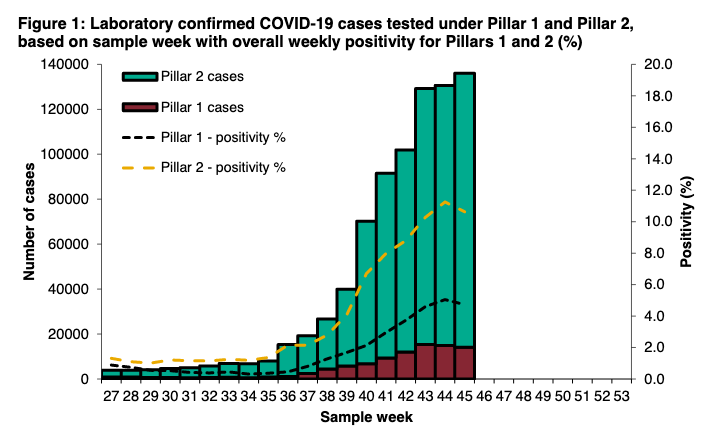
This is v helpful thread from @ScienceShared.

One thing missing is positive predictive and negative predictive values (PPV and NPV) that crucially depend on what proportion of people being tested have disease - the prevalence.
Take recent ONS survey - 1.1% of pop infected: PPV is 73%, meaning around 1 in 4 positive tests are false positives
(NPV is 99.7% - if you test -ve, you are)

Test 1000 people: there will be 8 true positives, 3 false positives, 3 false negatives, and 986 true negatives.
If in NW where prevalence is 2.2%, PPV rises to 84% (about 1 in 6 positive tests are false)

BUT in SE, prevalence is 0.5% meaning PPV is 55%, i.e. every other positive result is a false positive.
Of course, PPV will be much higher if you have symptoms, live with a case etc, but otherwise false positives from asymptomatic population screening remain an issue.

So as @ScienceShared says, positive tests in asymptomatic ppl should ideally be repeated or followed up with PCR.
And of course, as @angelaraffle has elegantly described, there are a whole range of reasons for caution and rigorous evaluation to mitigate unintended harm when it comes to population level screening.

Just to complete this thread.

High specificity means number of false +ve basically doesn't change as prevalence rises, but low sensitivity means false -ve⬆️ (where false reassurance comes in).

And the proportion of all positives that are false⬇️ as prevalence⬆️

Table below. Image
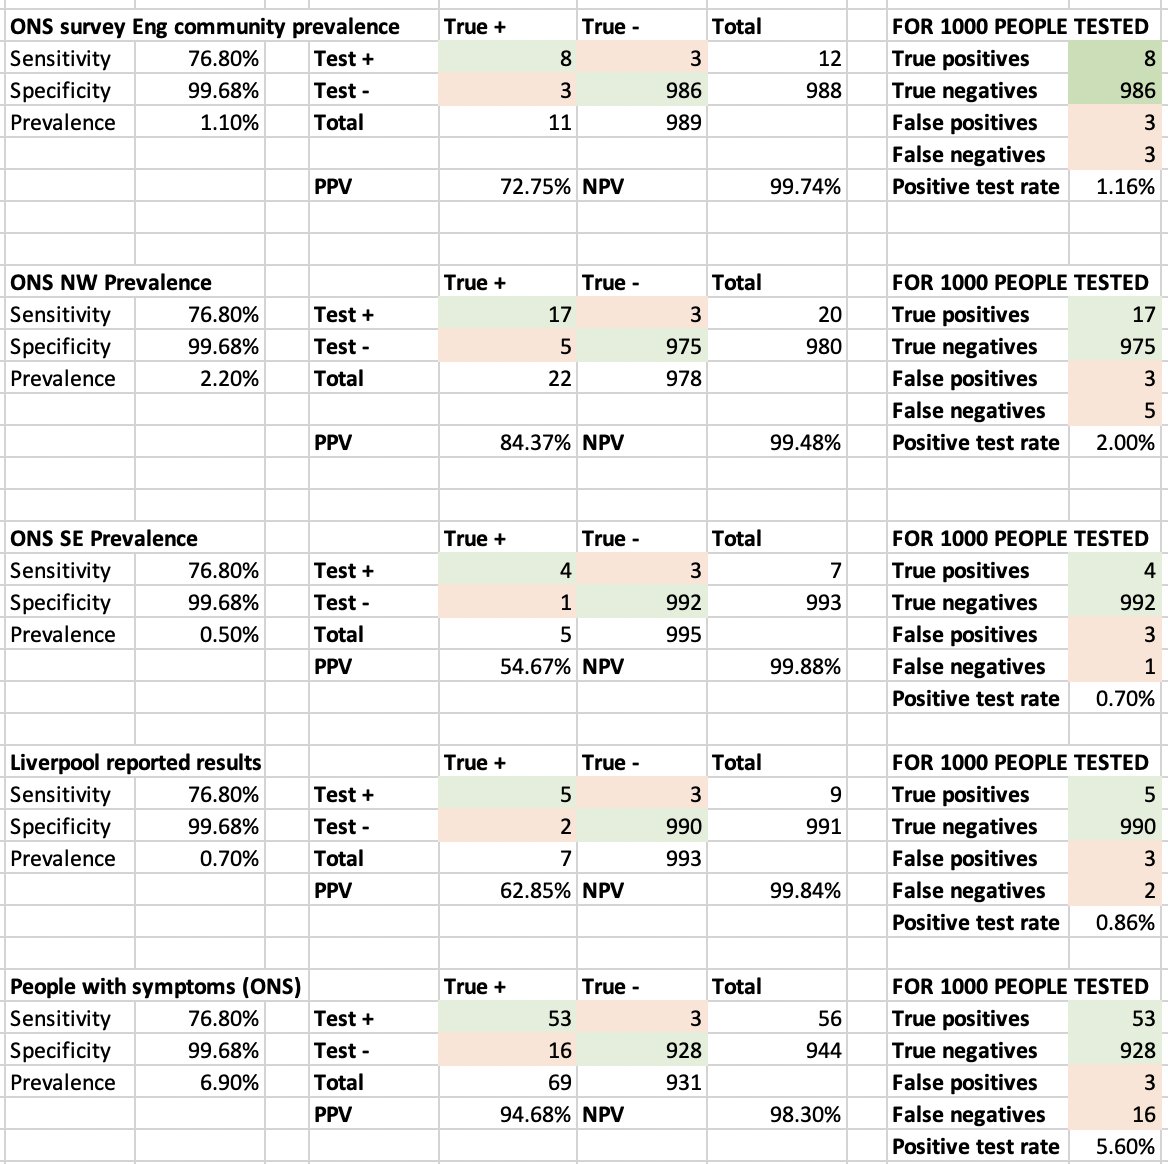
This table is all with the assumptions of the sensitivity and specificity as reported.

So in people with cough or temp or loss of smell, ONS suggests 6.9% test positive. In this group PPV is now 95%, and in every 1000 people get 53 true +ve, 3 false +ve, but 16 false -ve.
+ if these are the sens & spec in Liverpool, a true 0.7% prevalence among those tested would actually detect 9 cases/1000 (so would see a 0.9% prevalence).

So the reported results suggest asymptomatic community prevalence more like 0.5% to give 0.7% of people testing positive.

• • •

Missing some Tweet in this thread? You can try to force a refresh
 

Keep Current with Adam Briggs

Adam Briggs Profile picture

Stay in touch and get notified when new unrolls are available from this author!

Read all threads

This Thread may be Removed Anytime!

PDF

Twitter may remove this content at anytime! Save it as PDF for later use!

Try unrolling a thread yourself!

how to unroll video
  1. Follow @ThreadReaderApp to mention us!

  2. From a Twitter thread mention us with a keyword "unroll"
@threadreaderapp unroll

Practice here first or read more on our help page!

More from @ADMBriggs

12 Nov
Week 23 Test & Trace data summary. 29/10/20 – 04/11/20.

It's getting better but there's still a way to go.

Summary in pictures, detail in thread 👇

gov.uk/government/pub… Image
>1.5m people tested this week, 2% more than last week.

So whilst testing capacity's grown, it's not translating into more people being tested.

Number of positives up 8% as well to 149,253, across both pillar 1 and pillar 2. ImageImageImageImage
So despite more capacity, positivity ⬆️this wk (to 11.5% in P2, 5.1% in P1). Although today's PHE data suggests this rise may be stalling.

And still not separating symptomatic vs non-symptomatic testing, plus these results are before L'pool mass testing. ImageImage
Read 15 tweets
12 Nov
PHE's weekly surveillance report covering 2/11 to 8/11, short thread.

tl,dr - still lots of COVID, and still no flu.

gov.uk/government/sta…
Lots happened during this week
- schools back after half term
- Liverpool's mass testing started on 6th Nov
- national restrictions (second lockdown-ish) started 5th Nov
Number of cases continued to rise, but overall positivity dipped for the first time suggesting more testing now being done.

As mass testing starts, gets increasingly important to separate asymptomatic from symptomatic testing. Image
Read 15 tweets
5 Nov
Week 22 Test & Trace data summary. 22/10/20 – 28/10/20.

Tests⬇️, cases⬆️

Turnaround times much better, but overall performance unchanged meaning over 24,000 cases and 131,000 contacts still not reached.

Summary in pics, detail in thread

gov.uk/government/pub…
There were 1,482,528 individuals tested this week, which is actually 3% lower than the week before.

However, number of positive tests up by 8% to 137,180 (similar % increase for P1 and P2)

Plus now >10m people in Eng have been tested at least once - that's quite something.
Positivity rates climbing ever higher, and is now 10.9% in pillar 2 (9.9% the week before) and 4.8% in pillar 1 (4.2% the week before).

To make full sense of the picture, need to separate symptomatic vs asymptomatic testing. But shows STILL unlikely to be testing enough.
Read 22 tweets
5 Nov
PHE weekly flu and covid surveillance report for cases between 26/10 and 1/11.

Some takeaways.

TL;DR: hospitals are filling up, and not from flu.

assets.publishing.service.gov.uk/government/upl…
Slight drop in cases wk on wk, but positivity rate still rising. This essentially means we're still not doing enough tests.

(note, ONS survey to 23/10 suggests community cases still rising fast, at 52,000/day, approx 3 times as many)
Case rates falling in <40y/o (but still account for a little over half of cases), but rising in >40y/o.

Positivity rates for pillar 2 upwards of 15% for 10-19y/o. This is really high (WHO said in May should be <5% for easing lockdown measures).
Read 11 tweets
5 Nov
Latest update to our @HealthFdn Test and Trace performance tracker, with @cfraserepi:

health.org.uk/news-and-comme…
-Nearly 140,000 cases were handled in the most recent wk, 16% more than the previous week & a nine-fold increase since the start of September.

-The system has consistently been able to reach over 80% of cases, however the percentage of contacts reached stubbornly remains at 60%
-So, whilst 115,000 cases & 196,000 contacts were reached & advised to isolate, over 24,000 cases and 131,000 contacts weren’t.

The system is still far from achieving the 80% of contacts needed for the effective system recommended by the government’s SAGE.
Read 4 tweets
29 Oct
Week 21 Test & Trace data summary. 15/10/20 – 21/10/20.

Tests⬆️, cases⬆️, positivity⬆️, contacts⬆️.

And whilst performance on contact tracing is similar to last week in many areas, it's taking ever longer.

Summary in picture, detail in thread 👇

gov.uk/government/pub…
More individuals than every are being tested each week. Over 1.5m in the for the most recent week.

This is no small achievement.
Case numbers are also rising. Up 23% to 126,065 in 15/10-21/10.

Positivity also rising for both pillar 1 (NHS/PHE labs) - now 4.1%, and pillar 2 (community) - now 9.9%.

Today's PHE surveillance report to 25/10 shows very similar data.
Read 25 tweets

Did Thread Reader help you today?

Support us! We are indie developers!


This site is made by just two indie developers on a laptop doing marketing, support and development! Read more about the story.

Become a Premium Member ($3/month or $30/year) and get exclusive features!

Become Premium

Too expensive? Make a small donation by buying us coffee ($5) or help with server cost ($10)

Donate via Paypal Become our Patreon

Thank you for your support!

Follow Us on Twitter!