PHE's weekly surveillance report covering 2/11 to 8/11, short thread.
tl,dr - still lots of COVID, and still no flu.
gov.uk/government/sta…
tl,dr - still lots of COVID, and still no flu.
gov.uk/government/sta…
Lots happened during this week
- schools back after half term
- Liverpool's mass testing started on 6th Nov
- national restrictions (second lockdown-ish) started 5th Nov
- schools back after half term
- Liverpool's mass testing started on 6th Nov
- national restrictions (second lockdown-ish) started 5th Nov
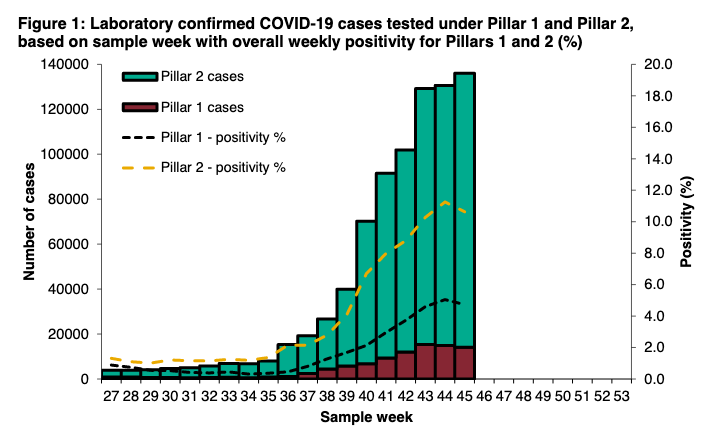
Number of cases continued to rise, but overall positivity dipped for the first time suggesting more testing now being done.
As mass testing starts, gets increasingly important to separate asymptomatic from symptomatic testing.
As mass testing starts, gets increasingly important to separate asymptomatic from symptomatic testing.

Case rates rising in EVERY age group. And still highest in 20-29y/o, but rising relatively quickly in some of the older age gps, esp 80+


Decline in case rates in NW really encouraging, but the continued steep rise across the Midlands is concerning.
Case rates generally much lower (and more stable) across S and E, compared to N and Midlands.
Case rates generally much lower (and more stable) across S and E, compared to N and Midlands.


Note, that these data (and nor will the following two weeks) reflect the impact of current lockdown, but regional tiered restrictions will be having an effect.
In inequalities by ethnicity and deprivation remain marked.


Probably the best two figures in the report.
Zero cases of flu detected through national surveillance, and one flu (A) related hospital admission.
Zero cases of flu detected through national surveillance, and one flu (A) related hospital admission.


As would expect, post half-term the number of clusters/incidents for primary/secondary educational settings continues to fall, but also look at college/uni. Almost none.
Despite this, most cases are still among student age cohort, but numbers falling.
Despite this, most cases are still among student age cohort, but numbers falling.


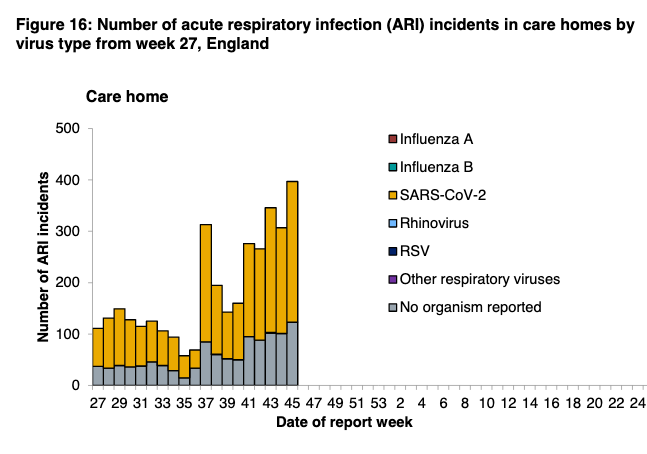
More concerning, relatively large jump in incidents in care homes.
The vaccine can't come fast enough for these settings pre-winter.
The vaccine can't come fast enough for these settings pre-winter.
Finally, again as expected, hospital admission rates go ever upwards.
NE particularly hard hit, East Midlands also rising - there's a 10-14 day lag b/w infection and admission, so current infection rates in those >60yrs directly translate to admissions down the line.
NE particularly hard hit, East Midlands also rising - there's a 10-14 day lag b/w infection and admission, so current infection rates in those >60yrs directly translate to admissions down the line.


This then translates to intensive care admissions.
These are rising everywhere as increasing numbers of older people are infected
These are rising everywhere as increasing numbers of older people are infected


Trends in deaths still upwards (interpret most recent week with caution as deaths are registered).
And clear excess mortality, especially NW.
And clear excess mortality, especially NW.


I really hope that current restrictions translate into slowing of rates of hospitalisations & deaths, but won't know for 3-4 weeks, earliest.
Fall in case rates in NW is encouraging, and suggests that restrictions may be having some impact in among everything else going on.
Fall in case rates in NW is encouraging, and suggests that restrictions may be having some impact in among everything else going on.
PHE surveillance rpt @felly500 @deb_cohen @martinmckee @carolecadwalla @mgtmccartney @ADPHUk @Jeanelleuk @fascinatorfun @profchrisham @petermbenglish @HPIAndyCowper @Davewwest @HSJEditor @KateAlvanley
@IndependentSage @nedwards_1 @SamanthaJonesUK @ewanbirney @FurberA
@IndependentSage @nedwards_1 @SamanthaJonesUK @ewanbirney @FurberA
• • •
Missing some Tweet in this thread? You can try to
force a refresh