
Week 23 Test & Trace data summary. 29/10/20 – 04/11/20.
It's getting better but there's still a way to go.
Summary in pictures, detail in thread 👇
gov.uk/government/pub…
It's getting better but there's still a way to go.
Summary in pictures, detail in thread 👇
gov.uk/government/pub…

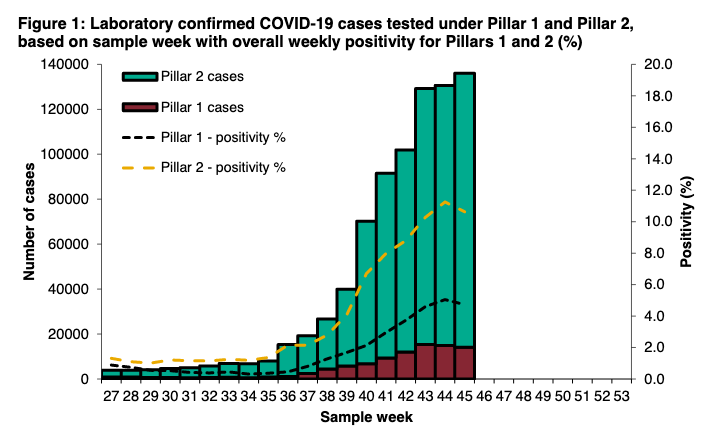
>1.5m people tested this week, 2% more than last week.
So whilst testing capacity's grown, it's not translating into more people being tested.
Number of positives up 8% as well to 149,253, across both pillar 1 and pillar 2.
So whilst testing capacity's grown, it's not translating into more people being tested.
Number of positives up 8% as well to 149,253, across both pillar 1 and pillar 2.


So despite more capacity, positivity ⬆️this wk (to 11.5% in P2, 5.1% in P1). Although today's PHE data suggests this rise may be stalling.
And still not separating symptomatic vs non-symptomatic testing, plus these results are before L'pool mass testing.
And still not separating symptomatic vs non-symptomatic testing, plus these results are before L'pool mass testing.

And here's today's PHE report which gives really useful detail about how cases vary by age/region, and how things are developing in hospitals.
https://twitter.com/ADMBriggs/status/1326904981157539844?s=20
Turnaround times for tests continue to make meaningful improvements.
But number of tests done has increased for all type except home kits where it's dropped from 195k in w/c 08/10 to 173k this wk. Hopefully this reflects demand rather than supply.
But number of tests done has increased for all type except home kits where it's dropped from 195k in w/c 08/10 to 173k this wk. Hopefully this reflects demand rather than supply.


141,804 cases transferred to the system, of which a record high of 85% were reached. This is more good news (can we cope?), but it does mean that 21,292 cases weren't reached.
Would still be very useful to know the contribution of local contact tracing systems to this figure.
Would still be very useful to know the contribution of local contact tracing systems to this figure.

Of these cases, 3,488 were managed by PHE Health Protection Teams (cases linked to outbreaks in particular settings), down 9% on last week.
So the increase is for cases managed by T&T, up 3% to 117,024.
So the increase is for cases managed by T&T, up 3% to 117,024.

82% of these cases (99,212) provided details of contacts, still relatively high.
Although this doesn't tell us if the other 18% didn't have any contacts or just don't want to speak with T&T.
Although this doesn't tell us if the other 18% didn't have any contacts or just don't want to speak with T&T.

And these cases identified 314,817 contacts. Down 4% on the week before and continuing a downward trend on numbers of contacts per case for both those managed by HPTs (now 3.2 contacts per case from 3.6 last wk), and those managed by T&T (2.6 down from 2.8)

The proportion of contacts reached & asked to isolate remains stubbornly at 60%.
125k not reached.
As more local authorities set up local contact tracing systems for hard to reach cases, I wouldn't be surprised if they're asked to help with hard to reach contacts in the future.
125k not reached.
As more local authorities set up local contact tracing systems for hard to reach cases, I wouldn't be surprised if they're asked to help with hard to reach contacts in the future.

But to finish on more good news, the proportion of cases reached within 24 hrs or being transferred to T&T, and the proportion of contacts reached within 24hrs are both continuing to improve.
The recent improvement after wk on wk worsening performance is fairly remarkable.
The recent improvement after wk on wk worsening performance is fairly remarkable.


Not to get carried away, if 85% of cases & 60% contacts are reached, that = only 51% of all contacts (generously assuming those not providing contact details don't actually have any).
Plus TT is identifying around 21.3k cases/day, compared to ONS's 45.7k/day (community only)
Plus TT is identifying around 21.3k cases/day, compared to ONS's 45.7k/day (community only)
So T&T still has a long way to go to be having the impact on transmission we all need (ideally >80% of all contacts reached and isolating).
And still don't know impact on inequalities, or of local contact tracing systems. But it's getting better.
And still don't know impact on inequalities, or of local contact tracing systems. But it's getting better.
Wk 23 T&T @felly500 @trishgreenhalgh @deb_cohen @martinmckee @carolecadwalla @mgtmccartney @ADPHUK @Jeanelleuk @fascinatorfun @profchrisham @petermbenglish @HPIAndyCowper @Davewwest @HSJEditor @KateAlvanley @IndependentSage @nedwards_1 @chrischirp @SamanthaJonesUK
• • •
Missing some Tweet in this thread? You can try to
force a refresh


