Week 21 Test & Trace data summary. 15/10/20 – 21/10/20.
Tests⬆️, cases⬆️, positivity⬆️, contacts⬆️.
And whilst performance on contact tracing is similar to last week in many areas, it's taking ever longer.
Summary in picture, detail in thread 👇
gov.uk/government/pub…
Tests⬆️, cases⬆️, positivity⬆️, contacts⬆️.
And whilst performance on contact tracing is similar to last week in many areas, it's taking ever longer.
Summary in picture, detail in thread 👇
gov.uk/government/pub…

More individuals than every are being tested each week. Over 1.5m in the for the most recent week.
This is no small achievement.
This is no small achievement.

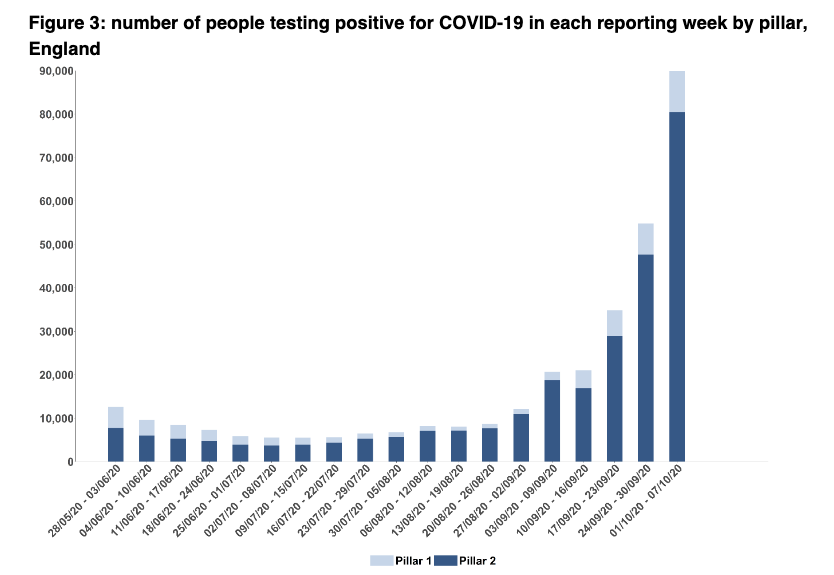
Case numbers are also rising. Up 23% to 126,065 in 15/10-21/10.
Positivity also rising for both pillar 1 (NHS/PHE labs) - now 4.1%, and pillar 2 (community) - now 9.9%.
Today's PHE surveillance report to 25/10 shows very similar data.
Positivity also rising for both pillar 1 (NHS/PHE labs) - now 4.1%, and pillar 2 (community) - now 9.9%.
Today's PHE surveillance report to 25/10 shows very similar data.


And note - as @_johnbye and @fascinatorfun have clearly argued, much of pillar 2 includes asymptomatic testing in care homes and some other settings, meaning positivity rates among symptomatic (in P2) are likely to be far higher still.
https://twitter.com/_johnbye/status/1321883858053246976?s=20
Today's PHE report also has loads of useful info on case and admission rates by age, region etc.
https://twitter.com/ADMBriggs/status/1321926113237585920?s=20
And here's @Dr_D_Robertson's heat map
https://twitter.com/Dr_D_Robertson/status/1321825254445121541?s=20
for test turnaround times, we have this remarkable note.

And despite much of the graph below jumping up an hour, turnaround time is better this week than last on all test methods/sites. A good thing.

For contact tracing, they've changed the complex vs non-complex case terminology to 'handled by PHE health protection team (HPT)' and 'not handled by health protection team'.

Those handled by PHE HPTs (along with their local authority colleagues) are still more complex. Involving outbreaks, high risk settings etc.
Those handled by T&T will include cases not reached by national team and handled by local authority contact tracing teams.
Those handled by T&T will include cases not reached by national team and handled by local authority contact tracing teams.
The change also coincides with a change in escalation criteria meaning some cases that work in care homes/schools that would have been complex, aren't any more. This may partly explain why complex case numbers aren't increasing nearly as much as community cases.
In week 21, 120,444 were transferred to T&T, up 25% and the first time over 100,000.
Percentage reached is still high at 81%. But whilst 97,014 cases were reached, that still leaves 23,428 cases not followed up.
Percentage reached is still high at 81%. But whilst 97,014 cases were reached, that still leaves 23,428 cases not followed up.

2,333 were managed by HPTs (complex), up just 9% on last week compared with 94,681 managed by T&T (non-complex) - up 23%.

and the percentage providing details of contacts also remains encouragingly above 84%.

But it's this graph that I think is most telling. The percentage of cases reached within 24hr of being transferred to T&T is now just 45%.
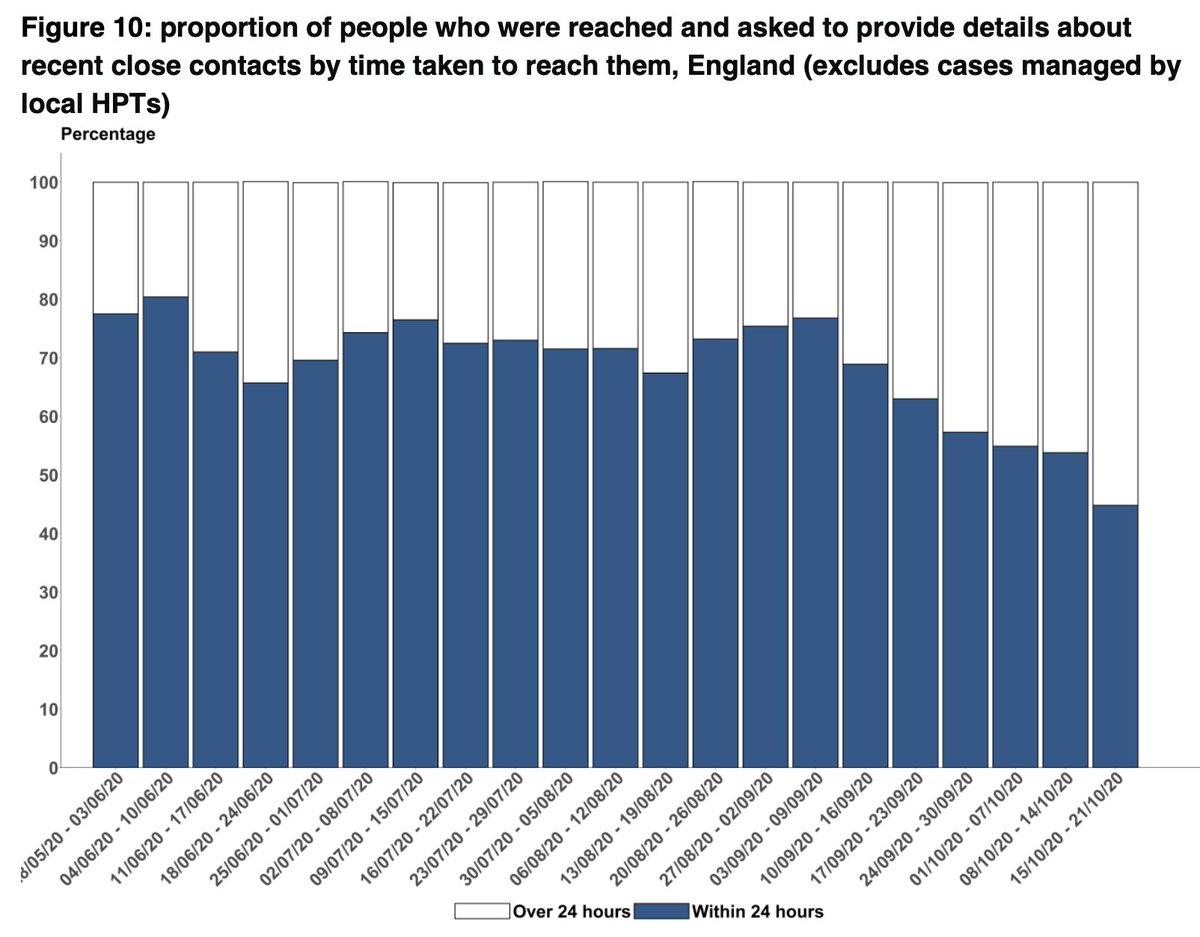
This has really significant implications for identifying contacts and controlling viral transmission. As well as for local contact tracing systems who receive cases from T&T who haven't been reached within 24hrs.
Much more that here if interested:
blogs.bmj.com/bmj/2020/10/28…
Much more that here if interested:
blogs.bmj.com/bmj/2020/10/28…
A vast 284,701 contacts were identified, with the 12% increase on last week driven entirely by cases managed by T&T (non-complex).

The avg contacts per case managed by T&T was 2.8. A drop from 3.1 the week before and generally keeping lower than in Sept. Given how the change in legislation around fines for non-compliance didn't seem to make a huge difference, the reduction may well be from less social mixing
But the trend down in number of contacts/case managed by HPTs (complex) is really falling. Now 6.7 down from 31 at start of Sept.
Guessing a combination of better social distancing, better PPE, fewer settings open, less visiting etc. But would love to explore this more.
Guessing a combination of better social distancing, better PPE, fewer settings open, less visiting etc. But would love to explore this more.

The percentage of contacts reached overall remains low at 60% (97% for contacts managed by HPTs, 58% for those managed by T&T)

And the overall percentage of contacts that are reached within 24hrs of a case being transferred to the system is now just 29%.
It was 58% at the start of Sept.
It was 58% at the start of Sept.

I really hope things improve. We still don't know from these data what the relative contribution is of local authority contact tracing vs the national team. But as SAGE commented, the overall system is still only likely to be “having a marginal impact on transmission.”
Wk 20 T&T ☝️
@felly500 @trishgreenhalgh @deb_cohen @martinmckee @carolecadwalla @mgtmccartney @ADPHUk @Jeanelleuk @fascinatorfun
@profchrisham @petermbenglish @HPIAndyCowper @Davewwest
@HSJEditor @KateAlvanley @IndependentSage @nedwards_1 @chrischirp
@SamanthaJonesUK
@felly500 @trishgreenhalgh @deb_cohen @martinmckee @carolecadwalla @mgtmccartney @ADPHUk @Jeanelleuk @fascinatorfun
@profchrisham @petermbenglish @HPIAndyCowper @Davewwest
@HSJEditor @KateAlvanley @IndependentSage @nedwards_1 @chrischirp
@SamanthaJonesUK
• • •
Missing some Tweet in this thread? You can try to
force a refresh