Can #Fractals be used to find the probable reversal on charts? Can it be used to find probable top and bottoms on #Stock Charts. Alone they might not. But lets dig into this possibility. I promised few days back of another model to find top and bottom. +
@rohit_katwal Fractals refer to a recurring pattern that occurs amid larger more chaotic price movements. Fractals are composed of Three or more bars. The rules for identifying fractals are as follows:
+
@rohit_katwal A bearish turning point occurs when there is a pattern with the highest high in the middle and two lower highs on each side.
A bullish turning point occurs when there is a pattern with the lowest low in the middle and two higher lows on each side.
+
@rohit_katwal Note that many other less perfect patterns can occur, but this basic pattern should remain intact for the fractal to be valid. Fractals are lagging indicators. A fractal can't be drawn until we are two days into the reversal. But can we increase the probability? +
@rohit_katwal We use standard deviation for this purpose. Standard Deviation is a measure of the amount of variation or dispersion of a set of values. Low SD means volatility is significantly low. High SD means volatility is significantly high. But what is significant? +
@rohit_katwal In a randomly distributed dataset :
68.27% of all data will be between +/- 1SD from the mean
95.45% of all data will be between +/- 2SD from the mean
99.73% of all data will be between +/- 3SD from the mean

So +/- 2 SD move from mean is signficant. +
@rohit_katwal Significant because only 4.55% moves happen out of this. Combined with Fractals, this is an excellent tool to predict statistically significant probable tops or bottom. Consider chart of Glenmark for eg. on 19 Jun 2020. This is a 3 SD move followed by fractal. +
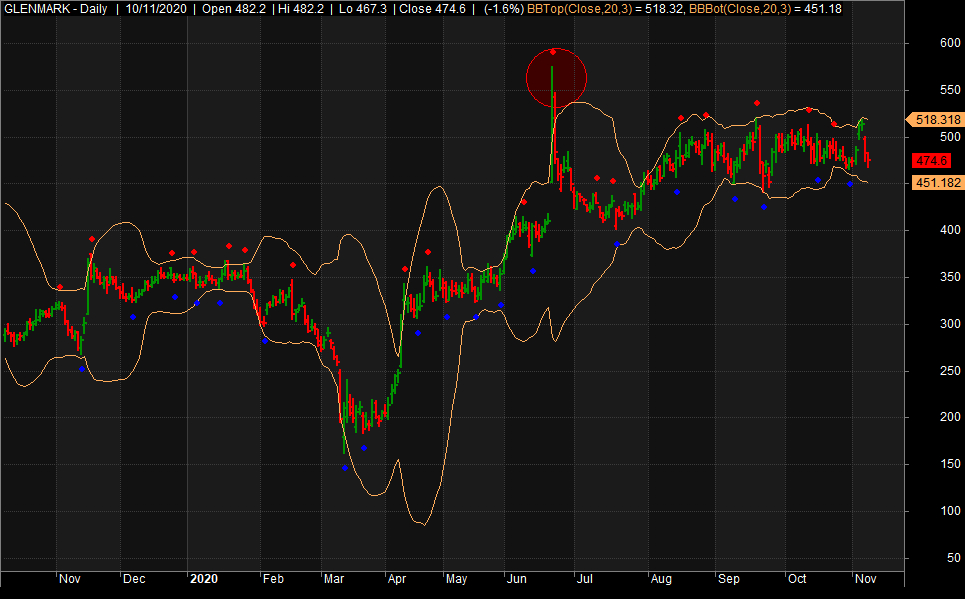
@rohit_katwal 3 SD means that this type of price event falls in 0.27% category. Either it will continue or it will fail. Immediately a 3 bar fractal forms. So recent high is a probable top with high as stoploss. Consider same on 13 Mar 2020. Another 3 SD move marking a bottom. +
@rohit_katwal So what are the rules:
For Probable Top:
"Price should form a 3 bar bearish fractal outside 20 Days / 3 SD Bollinger Bands" or "should form a 5 bar bearish fractal outside 20 days / 2 SD BB"
+
@rohit_katwal For Probable Bottom:
"Price should form a 3 bar bullish fractal outside 20 days / 3 SD Bollinger Bands" or "should for a 5 bar bullish fractal outside 20 days / 2 SD BB".

As an Option Writer, if we can get a probable top or bottom, we get an edge in trading. +
@rohit_katwal I can work on n strategies with High/Low as stoploss. My favorite, we can do Diagonal Calendars as much as we want. It gives us a statistical edge to find a significant top or bottom before any indicator with a SL in any kind of instruments.

#Nifty #BankNifty +
@rohit_katwal Do like, comment and retweet for benefit of trading community. End of educational thread.

Open for comments and discussion.

• • •

Missing some Tweet in this thread? You can try to force a refresh
 

Keep Current with Rohit Katwal

Rohit Katwal Profile picture

Stay in touch and get notified when new unrolls are available from this author!

Read all threads

This Thread may be Removed Anytime!

PDF

Twitter may remove this content at anytime! Save it as PDF for later use!

Try unrolling a thread yourself!

how to unroll video
  1. Follow @ThreadReaderApp to mention us!

  2. From a Twitter thread mention us with a keyword "unroll"
@threadreaderapp unroll

Practice here first or read more on our help page!

More from @rohit_katwal

7 Nov
Part 4: Understanding #OptionsBasic for #Nifty #BankNifty
In previous threads, we understood Intrinsic/Extrinsic value of options, how to achieve greek neutrality, risk management and how to define cheap or expensive options. Now

What Is Historical Volatility (HV)?
...1/n
@rohit_katwal Historical Volatility is a statistical measure of the dispersion of returns for a given security or index over a given period of time. This measure is calculated by determining the average deviation from the average price instrument in the given time period.

2/n
@rohit_katwal Using standard deviation is the most common, but not the only, way to calculate HV. The higher the historical volatility value, the riskier the security. However, that is not necessarily a bad result as risk works both ways - bullish and bearish.
3/n
Read 12 tweets
5 Nov
#QuoraQNA
Q. What is something that only someone who has been in the stock market for 10-15 years would know?

That profitability comes not from the trading system or some golden indicator or technical analysis of some kind.

#Nifty #BankNifty #OptionsTrading
+ Image
@rohit_katwal Profitability is a product of probabilities and proper Risk and Money Management.

Suppose you have ₹100,000/- as trading capital.

Your winning probability is 60% and risk-reward is 1:3.
+
@rohit_katwal Per trade, you deploy 20% of your capital with 1:3 risk-reward potential. You risk ₹1000 or you profit ₹3000/-.

If you trade it with discipline, over 10 trades you will lose ₹4000/- and win ₹12000/-.
+
Read 4 tweets
28 Oct
Is it possible to predict probable Top and Bottom on #Nifty #Nifty50 using #INDIAVIX ?

Lets find out.

#INDIAVIX is a measure of market’s expectation of volatility over the near term. VIX is computed using the order book of the underlying index options i.e #NIFTY.
...1/n
@rohit_katwal VIX is denoted as an annualized percentage. Higher the VIX, higher the expected volatility.

When Nifty goes up, VIX reduces. When Nifty goes down, VIX increases. Its an inverse relationship. Why?

In my past tweets, I mentioned IV is demand and supply.
...2/n
@rohit_katwal Puts are bought as hedge. When fear is less in the market, demand of puts is less and hence prices are low and hence low IV which results in Low Vix. When fear sets in, market dips and demand for put increases with increase in IV, VIX increases.

...3/n
Read 13 tweets
25 Oct
#Nifty volumes were pretty low on current futures but COI buildup is 3 lakh contracts. Consolidation underway. 78 Lakh contracts added on calls vs 44 lakh on put side. Still level 4 bullish on option chain. Given monthly expiry, one needs to be cautious.
1/n
@rohit_katwal I am holding 12000 Iron Fly. Will hold it if we are sideways and by end of day will square it off. If no direction then will take directional view on Tuesday.

If we go below below spot 11908, I will exit Iron Fly and hold Bear Call Spread.
2/n
@rohit_katwal If worst case scenario of opening at 11850 or below, will square off the losing put side which by virtue of theta decay will not give adverse loss as bear call spread is also there. Looking at SGX closing, it might not happen.
3/n
Read 5 tweets
23 Oct
As far as charts are considered, I do not look for Volume Interpretation when we are in a sideways channel. But once we are out of channel, I do give it importance.

Reason: Any symbol follows general rule of market. Trend>Accumulation/Distribution>Trend.
1/n
Now, this may vary from time frame to time frame and may have different interpretation when combining lower and bigger time frames. Once I spot a channel, volume and its interpretation inside it is irrelevant. Only the breakout.
2/n
Over period I have observed that a good sideways channel is with 50 to 60 plus bars with support and resistance break test of at least 3 times. Between that multiple tests will be done for a shakeout to either side. In rare cases we have V shaped or n-down movements.
3/n
Read 4 tweets
22 Oct
Why do only small traders lose money in the stock market instead of big traders?
Because of following reasons:
1. Under Capitalized
2. Compounding Returns
3. Seeking Paid Tips
4. Search for a Holy Grail
5. Not Understanding Reward:Risk and Probabilities
#TradingQNA #Nifty
...1/n
@rohit_katwal A good friend of mine wanted to trade in the markets for extra income. I am not against the idea. I tried putting him on the right track. I gave some basic trading books. I warned against leverage. I warned against paid advisory tips.
...2/n
@rohit_katwal I warned against trading with little capital. I tried to make him understand that it is a game of probability & risk management.

He started with Rs. 20,000/-. His idea was to make Rs. 500+ per day to call it a day. After 1 month, he had lost complete sum.
...3/n
Read 11 tweets

Did Thread Reader help you today?

Support us! We are indie developers!


This site is made by just two indie developers on a laptop doing marketing, support and development! Read more about the story.

Become a Premium Member ($3/month or $30/year) and get exclusive features!

Become Premium

Too expensive? Make a small donation by buying us coffee ($5) or help with server cost ($10)

Donate via Paypal Become our Patreon

Thank you for your support!

Follow Us on Twitter!