Irrespective of the fact that 50,000 of 5,000,000 is 1% rather than 0.1%, here's a v short selection of data that might help to clarify some of the differences between flu and COVID-19.
Short thread.
Short thread.
https://twitter.com/toadmeister/status/1328936943896420354
Fortunately, @PHE_uk have a flu surveillance programme.
Over past 5yrs, the worst flu season saw an estimated 22k deaths in Eng (2017/18).
So far ONS have recorded 55k deaths including COVID. Gov.uk estimate 46k.
It's not yet December.
assets.publishing.service.gov.uk/government/upl…
Over past 5yrs, the worst flu season saw an estimated 22k deaths in Eng (2017/18).
So far ONS have recorded 55k deaths including COVID. Gov.uk estimate 46k.
It's not yet December.
assets.publishing.service.gov.uk/government/upl…

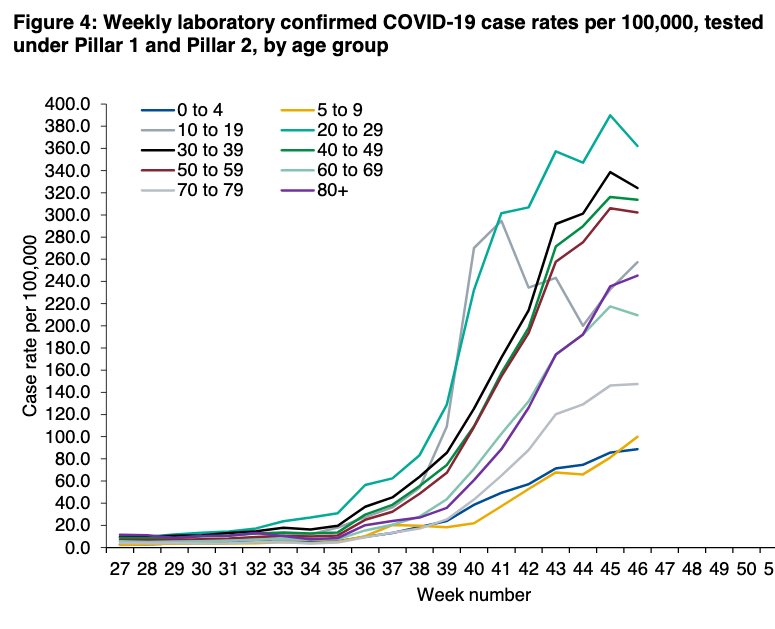
Hospital admission rates from flu in the past five years peaked in 2017/18 at around 10/100,000.
In the first week of November, it was already >14/100,000 and >25/100,000 in the NE.
In the first week of November, it was already >14/100,000 and >25/100,000 in the NE.


And of course, the fab folk at @ONS have already explicitly looked into this.
ons.gov.uk/peoplepopulati…
ons.gov.uk/peoplepopulati…

Finally, the paper that Toby Young is quoting is here.
As you might expect, the authors actually use an estimated COVID-19 IFR as a parameter in their model.🤦♂️
The IFR used has the range 0.37-1.15% based on a meta-analysis.
royalsocietypublishing.org/doi/10.1098/rs…
As you might expect, the authors actually use an estimated COVID-19 IFR as a parameter in their model.🤦♂️
The IFR used has the range 0.37-1.15% based on a meta-analysis.
royalsocietypublishing.org/doi/10.1098/rs…

• • •
Missing some Tweet in this thread? You can try to
force a refresh