Week 24 Test & Trace data summary. 05/11/20 – 11/11/20.
After two weeks of improvement, performance has stalled whilst the number of people testing positive continues to rise.
As ever, summary in pictures, detail in thread👇
gov.uk/government/pub…
After two weeks of improvement, performance has stalled whilst the number of people testing positive continues to rise.
As ever, summary in pictures, detail in thread👇
gov.uk/government/pub…
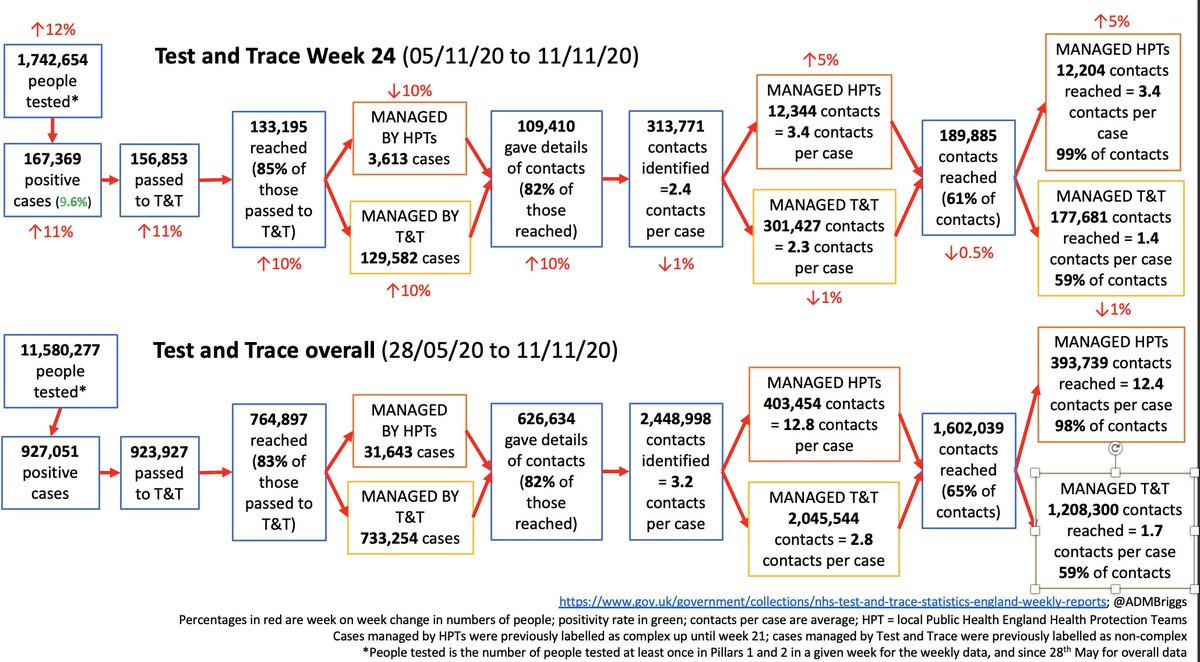


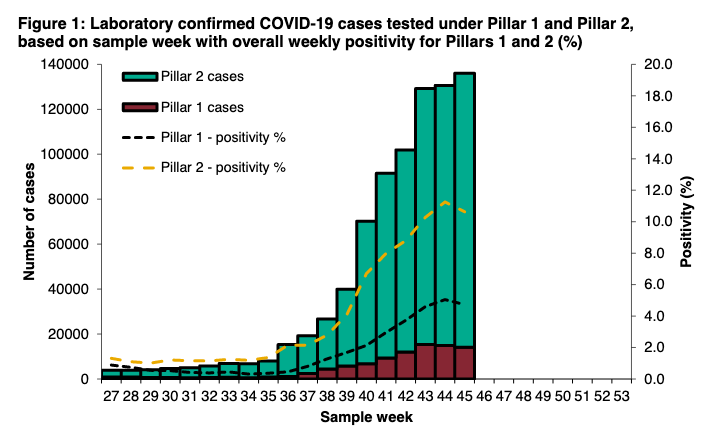
12% increase in people getting tested which is good (now 1.74m in a week(!)), but note from 6th Nov, pillar 2 now includes people having the rapid lateral flow tests (e.g. Liverpool pilot) and this will only increase in numbers.
The knock-on impact is lower P2 positivity rates.
The knock-on impact is lower P2 positivity rates.


The implications of this is that it makes it far harder to interpret positivity rates, esp if you don't separate out test device, or asymptomatic vs symptomatic testing.
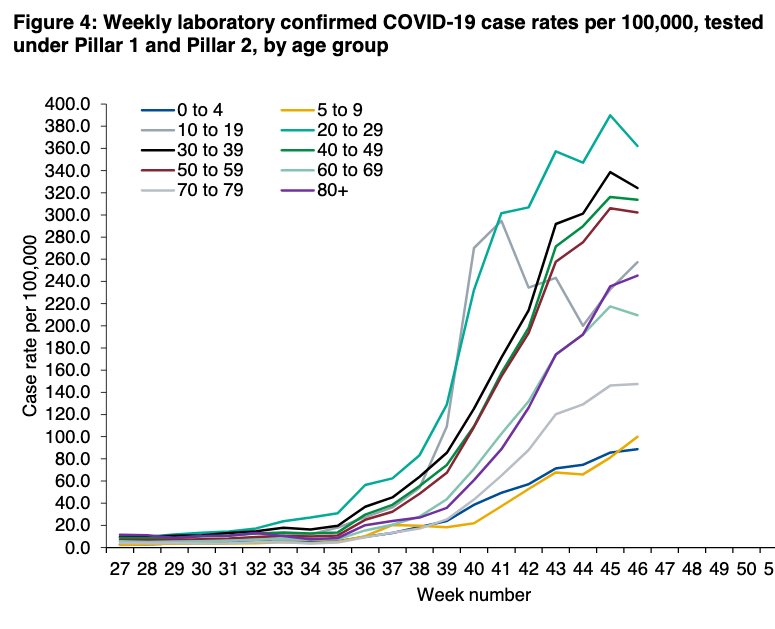
Cases up 11% in the week to 167,369, increases across both P1 and P2.

Case variation by age and region, including impact on hospitalisations and deaths covered here:
https://twitter.com/ADMBriggs/status/1329478341188087808?s=20
After two weeks of improvements in turnaround times, they've stalled this week (note, rapid lateral flow tests not included in turnaround times).


As has contact tracing performance.
There were 133,195 cases reached - 85%, which is the same proportion as the week before (although this is high relative to most of the time since T&T launched)
There were 133,195 cases reached - 85%, which is the same proportion as the week before (although this is high relative to most of the time since T&T launched)

And of these cases, 3,613 were part of outbreaks in high risk areas and therefore managed by PHE health protections teams, 10% fewer than week before, and 129,582 were managed by the T&T call handlers or local contact tracing systems.
And the proportion of cases providing details of contacts also has settled at around 82%

Despite a 10% in the number of cases reached, there was fall of 1% in the number of contacts identified - 313,771.
This is because contacts per case dropped for cases not handled by HPTs to just 2.3 (down from 2.6). The wk on wk fall for cases handled by HPTs stopped (is 3.4)
This is because contacts per case dropped for cases not handled by HPTs to just 2.3 (down from 2.6). The wk on wk fall for cases handled by HPTs stopped (is 3.4)

And again another example of where T&T is really struggling to improve is percentage of contact reached. Still 99% for cases handled by HPTs, and languishing at 59% for all the other cases.

This means that overall, optimistically just 51% of contacts of known cases are likely to be reach (85% of contacts reached, and 61% of contacts, assuming those who say they don't have contacts really don't).
This is still far from what's needed to really make a dent on spread.
This is still far from what's needed to really make a dent on spread.
It also means over 23k known cases and 123k known contacts not reached.
Not to mention cases not tested, contacts not shared with T&T, and the proportion of people who actually go on to isolate.
gov.uk/government/pub…
Not to mention cases not tested, contacts not shared with T&T, and the proportion of people who actually go on to isolate.
gov.uk/government/pub…
The data by local authority was updated this wk to record location of cases & contacts based on where the test was rather than GP is registered.
Despite this there's huge variation by local authority (20%+) with significant unquantified potential impact on inequalities.
Despite this there's huge variation by local authority (20%+) with significant unquantified potential impact on inequalities.


And finally, timeliness of contact tracing again stalled after two weeks of improvements. With 73% of cases reached within 24hrs, and 45% of contacts.


As ever, we still don't have data on the relative contribution of local authority contact tracing systems, and it would be so useful to know how they're contributing to the overall system performance.
In general, it's a much better T&T picture than three weeks ago, but for contact tracing, there still a long way to go.
Changes are def being made across the system and fingers crossed they help as we head towards December.
health.org.uk/news-and-comme…
Changes are def being made across the system and fingers crossed they help as we head towards December.
health.org.uk/news-and-comme…
Wk 24 T&T @felly500 @trishgreenhalgh @deb_cohen @martinmckee @carolecadwalla @mgtmccartney @ADPHUK @Jeanelleuk @fascinatorfun @profchrisham @petermbenglish @HPIAndyCowper @Davewwest @HSJEditor @KateAlvanley @IndependentSage @nedwards_1 @chrischirp @SamanthaJonesUK
• • •
Missing some Tweet in this thread? You can try to
force a refresh