Latest PHE flu & COVID surveillance report, up to 15th Nov.
- ⬆️Case rates in over 70yrs.
- ⬆️hospitalisations, ICU admissions & deaths.
- Big variation by region, ethnicity, age, and deprivation.
- (+ some good news on flu & flu jabs)
gov.uk/government/sta…
- ⬆️Case rates in over 70yrs.
- ⬆️hospitalisations, ICU admissions & deaths.
- Big variation by region, ethnicity, age, and deprivation.
- (+ some good news on flu & flu jabs)
gov.uk/government/sta…
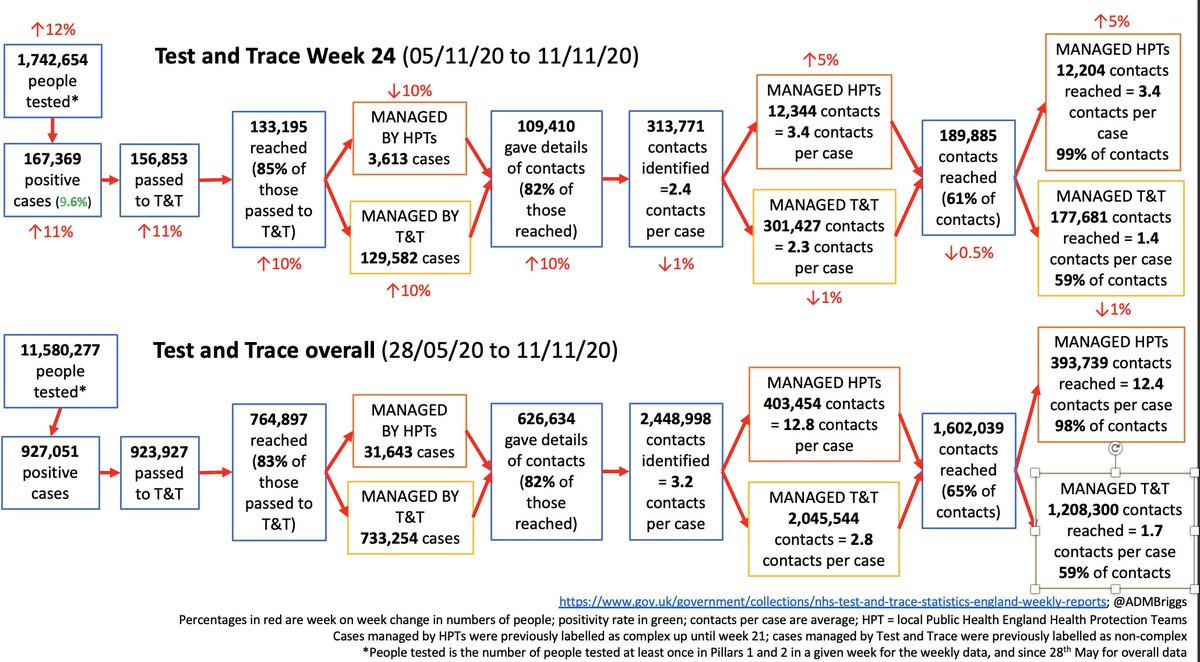
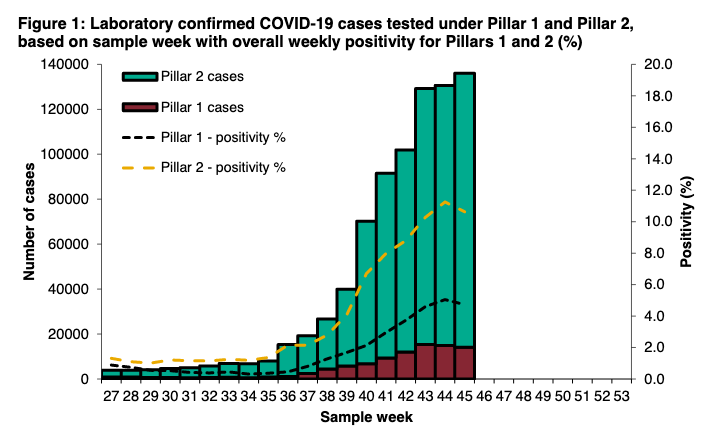
Confirmed cases of COVID plateaued this week, and positivity rates dropping.
Still probably a little early to see results of 6th Nov restrictions, but local restrictions likely important. And new use of lateral flow tests (pillar 2) may be contributing to lower positivity rates.
Still probably a little early to see results of 6th Nov restrictions, but local restrictions likely important. And new use of lateral flow tests (pillar 2) may be contributing to lower positivity rates.

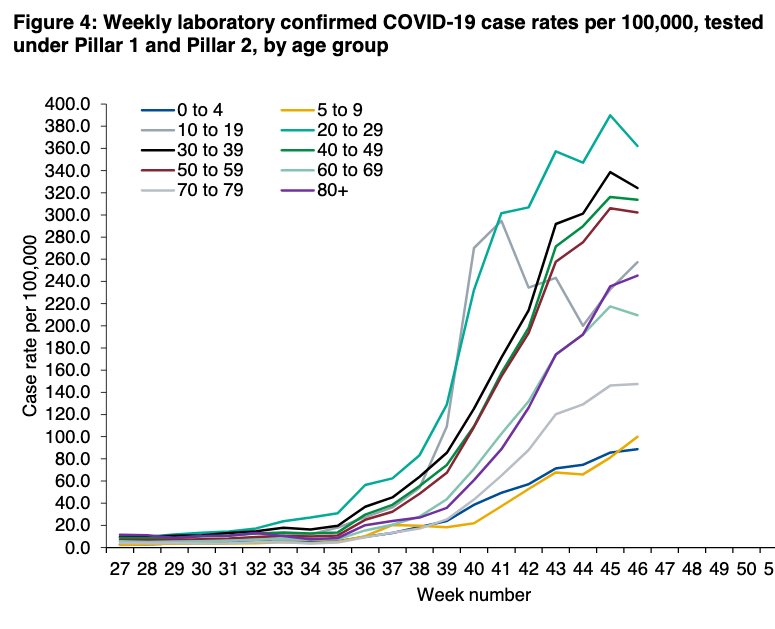
And case rates falling across most aged but crucially NOT among age 70yrs+
The North + Midlands vs South divide still v marked, but (generally) things improving in the N/Mids, and getting worse in the S.


Inequalities by ethnicity and deprivation are as stark as ever.


Also note differences by ethnicity b/w first wave and second. Other ethnic groups v over-represented in both, but people of Black ethnic groups far more likely to get infected in the first wave cf the second, and vice versa for ppl of some Asian ethnic groups.


Number of COVID outbreaks in primary and secondard schools has pretty much doubled this week (two wks after half term). Although ONS data suggest community case rates in school age children still flat or falling.
Tomorrow's ONS survey data by age will be interesting.
Tomorrow's ONS survey data by age will be interesting.


Also alongside the increase in cases over 70yrs, more outbreaks in care homes being reported.

After a slight pause last week, hospitalisations continue to climb across most of the country.
Although note NW where 4 weeks(ish) of falling case numbers seems to have slowed hospitalisations
Although note NW where 4 weeks(ish) of falling case numbers seems to have slowed hospitalisations


And ICU admissions also still climbing, but more regional variation (look at East Mids).


Sadly deaths and excess mortality also following suit


But to finish on a more positive note. No flu-related hospital admissions this week, and just one case picked up through routine surveillance.


And flu vax uptake is the HIGHEST EVER at this stage for age 65+ & age 2-3years.
This is brilliant news and shows just how hard GPs & the teams involved have worked on this.
If you're eligible, please get vaccinated. You (and the NHS) really don't want flu right now.
This is brilliant news and shows just how hard GPs & the teams involved have worked on this.
If you're eligible, please get vaccinated. You (and the NHS) really don't want flu right now.


In summary, whilst overall case numbers might be stabilising, they're still rising in over 70yrs+, the health system remains under huge pressure, and it's still likely to get worse before it gets better.
Please stay at home where you can.
Please stay at home where you can.
PHE surveillance rpt @felly500 @deb_cohen @martinmckee @carolecadwalla @mgtmccartney @ADPHUk @Jeanelleuk @fascinatorfun @profchrisham @petermbenglish @HPIAndyCowper @Davewwest @HSJEditor @KateAlvanley @IndependentSage @nedwards_1 @SamanthaJonesUK @ewanbirney @FurberA
• • •
Missing some Tweet in this thread? You can try to
force a refresh