Our new short analysis in @TheLancet with @cfraserepi.
Is Test and Trace exacerbating inequalities?
Tl,dr: the more deprived somewhere is, the less likely cases and contacts are reached by Test and Trace
thelancet.com/journals/lance…
Is Test and Trace exacerbating inequalities?
Tl,dr: the more deprived somewhere is, the less likely cases and contacts are reached by Test and Trace
thelancet.com/journals/lance…


The disproportionate effects of COVID on more deprived populations are well known.
People in more deprived areas are more likely to get infected and to die.
See @PHE_uk/@ProfKevinFenton's excellent review
gov.uk/government/pub…
People in more deprived areas are more likely to get infected and to die.
See @PHE_uk/@ProfKevinFenton's excellent review
gov.uk/government/pub…
And the detrimental impact of social restrictions/lockdown is also greater among more vulnerable populations
See this @bmj_latest piece from @sandrogalea and colleagues:
bmj.com/content/371/bm…
See this @bmj_latest piece from @sandrogalea and colleagues:
bmj.com/content/371/bm…
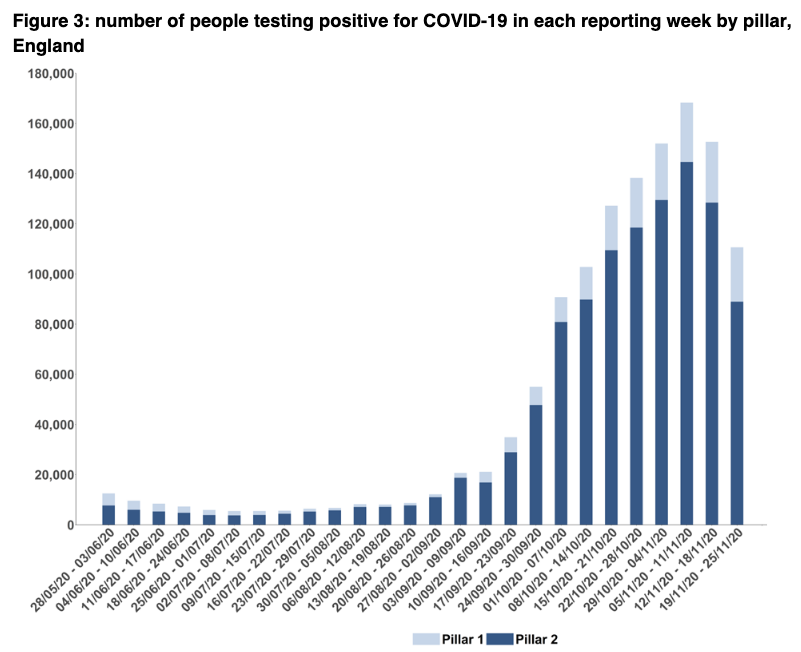
We ranked upper tier local authorities by average 2019 index of multiple deprivation, divided them into fifths/quintiles, and looked at the percentage of cases and contacts reached across each deprivation quintile.
B/w 28 May & 18 Nov, 86% of cases in least deprived quintile were reached compared with 83% in the most.
For contacts, it was 62% vs 56%.
For contacts, it was 62% vs 56%.


If the most deprived quintile had same success rate as the least over that period, 9,000 more cases & 42,500 contacts would have been reached in the most deprived populations.
If all quintiles had the same success rate as the least deprived, it's 23k more cases & 72.5k contacts.
If all quintiles had the same success rate as the least deprived, it's 23k more cases & 72.5k contacts.
What's causing this?
You can't tell from the information available. There's no weekly data to see how much things like age, employment status, type of housing etc might have a role
You can't tell from the information available. There's no weekly data to see how much things like age, employment status, type of housing etc might have a role
You also can't fully interpret how things like changing infection rates over time or social restrictions might have affected things.
Nor the impact of local systems/structural factors/isolation support.
Nor the impact of local systems/structural factors/isolation support.
And finally, if deprivation is driving much of this, what bits of contact tracing need to be improved? Is it how calls are made and handled? What's role of local contact tracing? What about the fines and isolation support available?
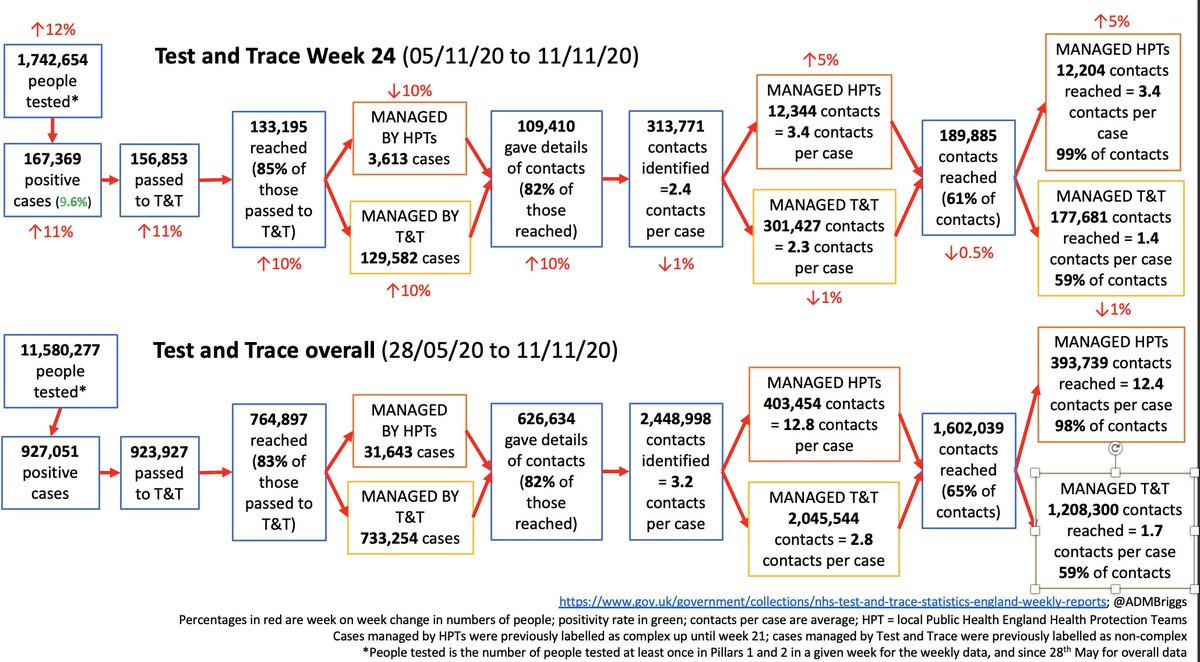
We know T&T isn't performing at the level it needs to, and we also know that isolation compliance may be as low as around 1 in 5 cases fully following the guidance.
https://twitter.com/ADMBriggs/status/1334548042352103425?s=20
To improve, local systems working with T&T have a role in contacting more hard-to-reach cases, and should probably work with hard-to-reach contacts as well.
Local systems know their populations - use local numbers, voices, support info, and are trusted.
Local systems know their populations - use local numbers, voices, support info, and are trusted.
But they're also doing mass testing, and mass vaccination, and everything else besides.
So they need to be supported and expectations of their impact has to be realistic.
So they need to be supported and expectations of their impact has to be realistic.
Their role & the impact of the national team can be helped by ensuring that people who do need to isolate are no worse off from doing so, and are adequately helped socially/practically to isolate.
gov.uk/government/pub…
gov.uk/government/pub…
Mass testing is also ramping up.And while it may have a some role in case finding, there's a big risk it could widen inequalities yet further that needs to be mitigated (ppl need time and to be in a position to get repeat tests, interpret & report results using phones/apps, etc)
Whatever the underlying cause, T&T must do everything it can to ensure inequalities exposed by COVID-19 aren’t exacerbated further.
This means understanding why differences exist & using it's £37bn 2yr-budget to ensure it equitably reaches and supports those who need it most.
This means understanding why differences exist & using it's £37bn 2yr-budget to ensure it equitably reaches and supports those who need it most.
Our press statement and all the neat @HealthFdn figures can be found here.
health.org.uk/news-and-comme…
health.org.uk/news-and-comme…
new today in case of interest☝️@felly500 @trishgreenhalgh @deb_cohen @martinmckee @carolecadwalla @mgtmccartney @ADPHUk @Jeanelleuk @fascinatorfun @profchrisham @petermbenglish @HPIAndyCowper @Davewwest @HSJEditor @KateAlvanley @IndependentSage @nedwards_1 @chrischirp @ewanbirney
• • •
Missing some Tweet in this thread? You can try to
force a refresh