Wk 25 T&T report thread. 12 - 18 Nov.
tl,dr: cases down, contacts up, improvements stalled, and £37bn is a lot of money.
Summary in pic, details in thread.
gov.uk/government/pub…
tl,dr: cases down, contacts up, improvements stalled, and £37bn is a lot of money.
Summary in pic, details in thread.
gov.uk/government/pub…

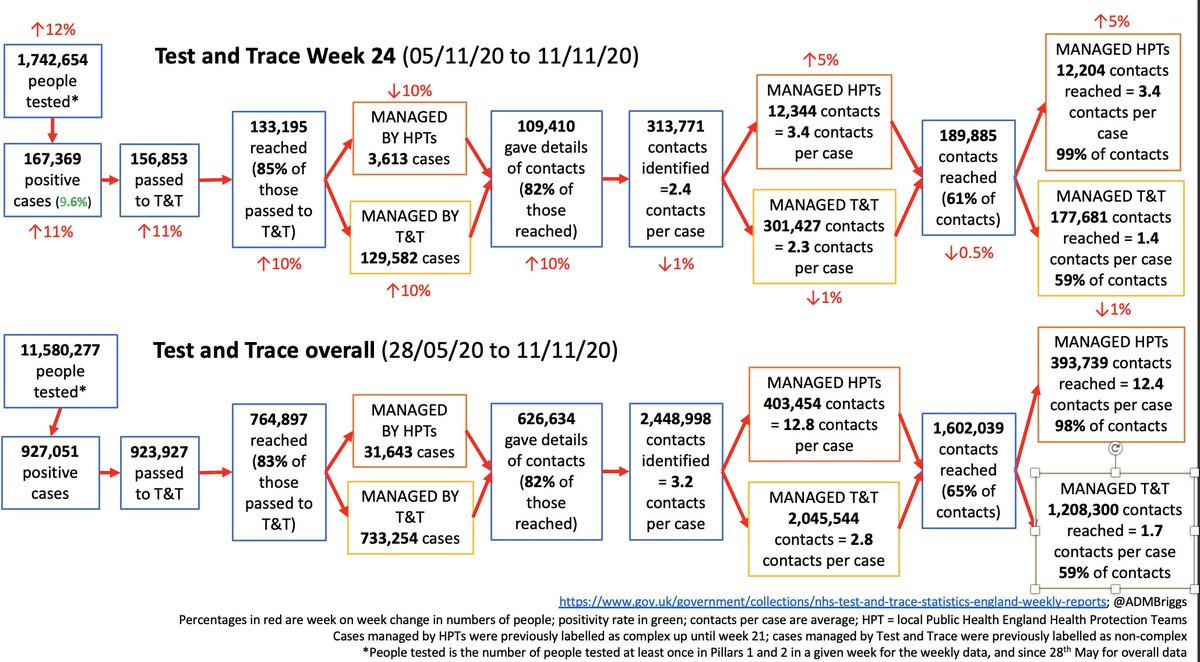
Interesting that number of individuals tested down by 1% this week (although that's still 1.74m people).
This includes the lateral flow devices being used in Liverpool and some other settings (reported in pillar 2).
This includes the lateral flow devices being used in Liverpool and some other settings (reported in pillar 2).

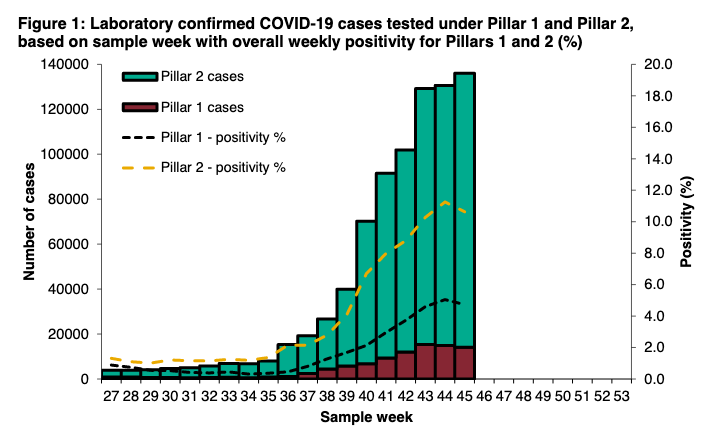
Cases fell for the first time since mid-August. Down 9% to 152,660, and positivity also down. This is consistent with PHE data today, as well as ONS survey.


Also general better news all round with turnaround times on testing. This may (in part) reflect a system that's generally less stretched.


For contact tracing, there were 156,574 case transferred to the system, of which 132,905 (85%) were reached. Last week was 86%, and whilst this is still pretty high, 23,669 cases weren't reached.

And as with previous weeks, around 3% of cases were handled by PHE health protection teams (part of outbreaks in specific settings) and the remainder handled by the national T&T team (or local contact tracing teams where the national team can't reach cases)

81% of cases provided details of one or more close contact, and whilst it's been around this level for a while, the trend does look to be tapering off slightly.

I wonder how much of this is cases & contacts being in same household.
We know from local contact tracing that HHs with >1 case and multiple HH contacts can receive huge numbers of calls, making people less willing to engage.
And proportion of contacts that are same HH is rising.
We know from local contact tracing that HHs with >1 case and multiple HH contacts can receive huge numbers of calls, making people less willing to engage.
And proportion of contacts that are same HH is rising.

In terms of timing, after a couple of wks' improvements, the number of cases reached within 24hrs (v important for local contact tracing systems who get cases *not* reached by national team w/i 24hrs) has now stalled at around 71% for 3 wks in a row.

On contacts, despite number of cases giving details of contacts falling by 2%, the number of contacts increased by 11% to 347,575.
This reflects a rise in contacts/case among those not managed by PHE teams from 2.3 to 2.6.
This reflects a rise in contacts/case among those not managed by PHE teams from 2.3 to 2.6.

It's really hard to know why this might be - people more willing to give information, more mixing, random variation?
It does go against 5 weeks of downward trend from 3.1 contacts per case in wk of 08/10, to 2.3 last week.
It does go against 5 weeks of downward trend from 3.1 contacts per case in wk of 08/10, to 2.3 last week.
Either way, the percentage reached hasn't budged. 59% reached by the national system, and 60% overall.
That's 210k contacts reached.
And 138k not reached.
That's 210k contacts reached.
And 138k not reached.

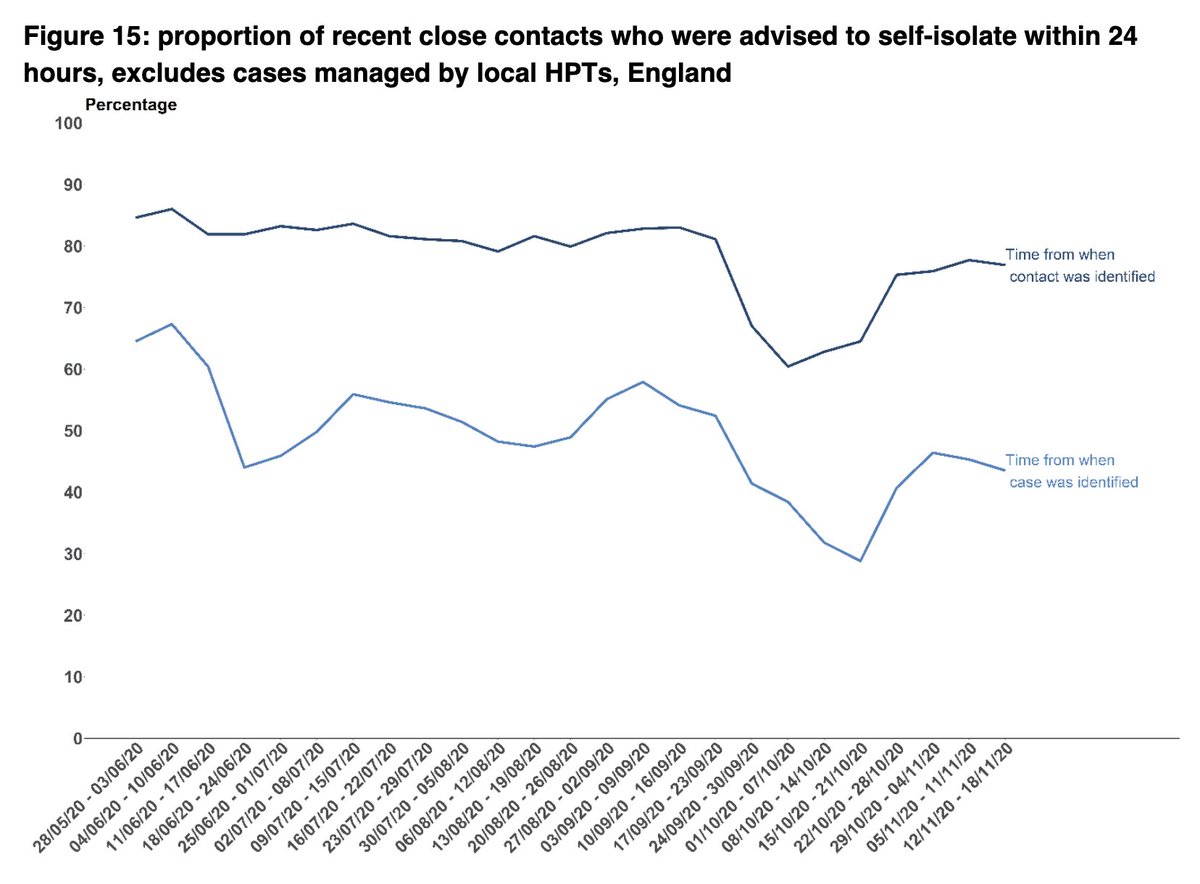
The time to reach contacts is worsening again.
Now 44% of contacts reached within 24hrs of a case being transferred.
Now 44% of contacts reached within 24hrs of a case being transferred.
As keeps getting emphasised, irrespective of mass testing ambitions and of rolling out vaccines, contact tracing still has a huge role to play in managing COVID, and it will continue to do so for many months yet.
T&T now has a 2yr budget of £37bn.
T&T now has a 2yr budget of £37bn.
In terms of improving the system, there are clearly still lots of marginal gains to be had, there are more local systems in place, and tonnes of learning to be had about how these work and how they best interact with the national team
And people must be no worse off if isolating
And people must be no worse off if isolating
Isolating if you have symptoms, a positive test result, or are identified as a contact is critical to stop transmission, but it can be really hard to do for loads of reasons, with big big implications for inequalities.
There's £500 for people fulfilling specific criteria, and local govs have put in place lots of support infrastructure.
But the impact of the T&T model on inequalities is still unclear, and there seems to be no coherent national targeted strategy to help those who need it most.
But the impact of the T&T model on inequalities is still unclear, and there seems to be no coherent national targeted strategy to help those who need it most.
Without this, many people aren't going to go and get tested, and aren't going to isolate. So whilst mass testing sounds good, and improving contact tracing will inevitably help, neither solve this underlying issue. £37bn is a lot of money.
And happy thanksgiving everyone. Our pumpkin pie was undercooked, but it still tasted good and we needed to get the kids to bed. 🦃
Wk 25 T&T @felly500 @trishgreenhalgh @deb_cohen @martinmckee @carolecadwalla @mgtmccartney @ADPHUk
@Jeanelleuk @fascinatorfun @profchrisham @petermbenglish @HPIAndyCowper @Davewwest @HSJEditor @KateAlvanley @IndependentSage @nedwards_1 @chrischirp @SamanthaJonesUK
@Jeanelleuk @fascinatorfun @profchrisham @petermbenglish @HPIAndyCowper @Davewwest @HSJEditor @KateAlvanley @IndependentSage @nedwards_1 @chrischirp @SamanthaJonesUK
• • •
Missing some Tweet in this thread? You can try to
force a refresh