Adam Briggs Profile picture
26 Nov, 15 tweets, 11 min read
Latest PHE covid/flu report thread.
Covers 16th - 22nd Nov.

COVID rates and hospitalisations are falling, but there are important big regional variations.

And the number of children and over 65y/os getting their flu jab is already higher than last year!

gov.uk/government/sta…
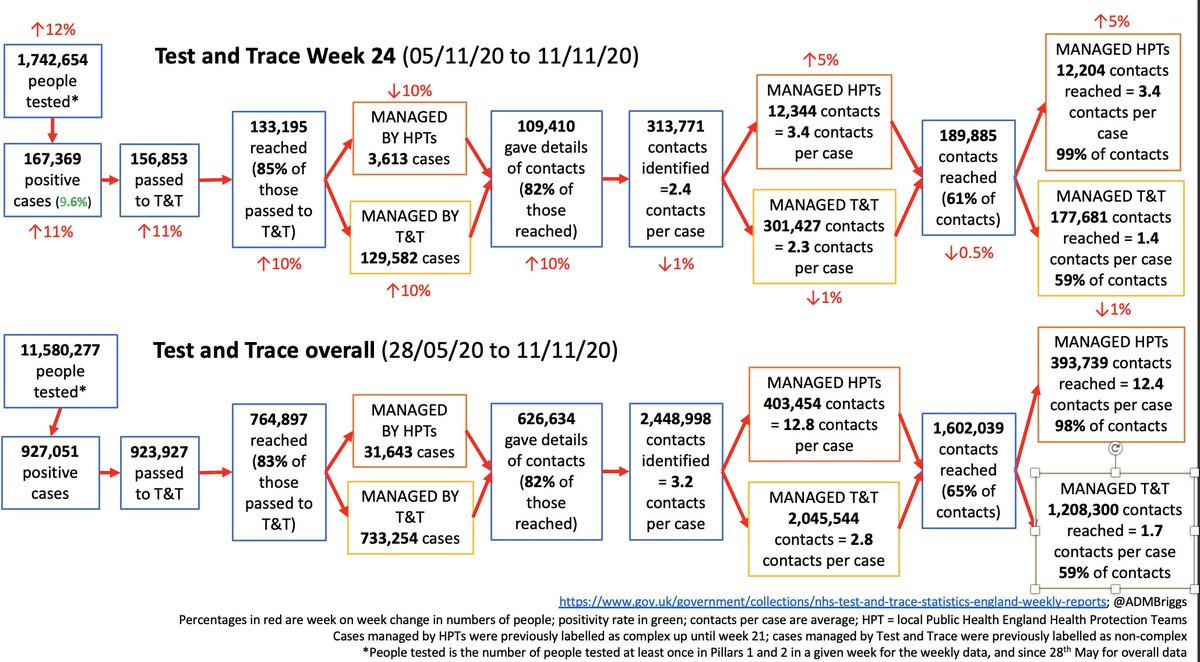
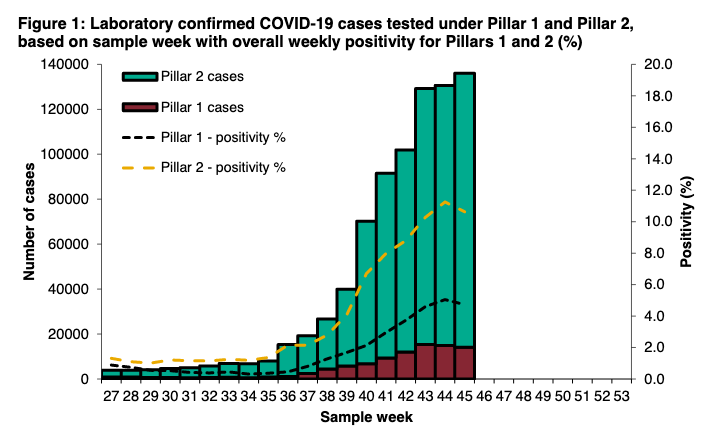
Welcome signs that case numbers and case rates are falling both in PHE data & ONS survey

Not going to disentangle positivity rates here, mass/lateral flow testing is in pillar 2, many will have confirmatory PCRs, & ideally symptomatic vs asymptomatic would be reported separately
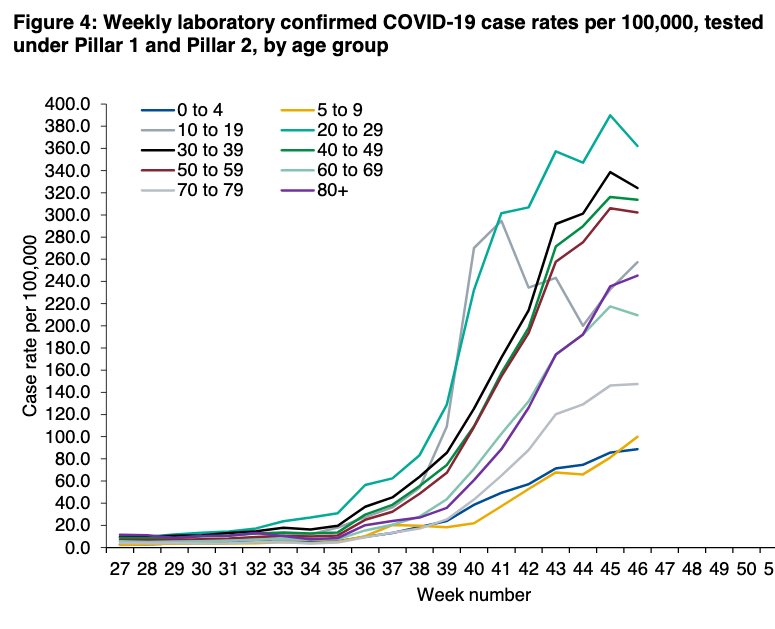
And these falling case rates are across ALL age groups and ALL regions.
Although when you look in more detail at the regional data, you can see that in some regions (e.g. SE, London), rates among some older age groups still look to be rising
And the NW/NE no longer completely dominate, with high rates in SE
(worth noting ONS data by age is pretty consistent with this, but by region, ONS suggest that community rates in NE and East Mids may still be going up)
Rates also falling across all ethnicities and deprivation groups (except for more deprived 10-16y/os), but inequalities remain.
No real change in number of outbreaks in care homes or schools. There are still a lot of them, but a relief to see that they're not rising after last week's jump.
This is also the first week in the past 2.5 months that there's been a drop in total hospital admission rates.

But this is driven by falls in North and East Midlands. Admissions still rising across the South
Also overall fall in ITU admissions driven by drops in NE and NW. But worrying rise in the Midlands, est West Mids where admission rates haven't yet started to fall.
And death rates (with their 3-4 week lag following infection) still continue to trend up (note recent deaths are not included), and excess mortality remains high.

Here the North does still dominate. But hopefully this will start to fall soon.
Still very little flu (just three admissions and three cases identified through the national surveillance programme).

And flu vaccine uptake whilst low among pregnant women (may be a data error here), it's already higher than last yr for over 65yrs and yr 2 and 3 children. 🙌
So in general, this is pretty good news.

National restrictions from 2-3 wks ago, plus all the local measures (COVID secure teams, schools teams, comms, local contact tracing etc) seem to have had a role.
But case rates, hospitalisation rates & death rates remain relatively very high, plus there's big geographic variation.

Everyone's actions still really matter.

• • •

Missing some Tweet in this thread? You can try to force a refresh
 

Keep Current with Adam Briggs

Adam Briggs Profile picture

Stay in touch and get notified when new unrolls are available from this author!

Read all threads

This Thread may be Removed Anytime!

PDF

Twitter may remove this content at anytime! Save it as PDF for later use!

Try unrolling a thread yourself!

how to unroll video
  1. Follow @ThreadReaderApp to mention us!

  2. From a Twitter thread mention us with a keyword "unroll"
@threadreaderapp unroll

Practice here first or read more on our help page!

More from @ADMBriggs

26 Nov
Wk 25 T&T report thread. 12 - 18 Nov.

tl,dr: cases down, contacts up, improvements stalled, and £37bn is a lot of money.

Summary in pic, details in thread.
gov.uk/government/pub… Image
Interesting that number of individuals tested down by 1% this week (although that's still 1.74m people).
This includes the lateral flow devices being used in Liverpool and some other settings (reported in pillar 2). Image
Cases fell for the first time since mid-August. Down 9% to 152,660, and positivity also down. This is consistent with PHE data today, as well as ONS survey. ImageImageImageImage
Read 21 tweets
23 Nov
ICYMI, today the gov launched the COVID Winter Plan.

It includes an additional £7bn for Test & Trace, who's budget now stands at £22bn.

The comparison with PHE's entire budget is old news. But in case it helps, it was £300m.

gov.uk/government/pub… Image
There can surely be very little argument left against reversing long term cuts to public health budgets.

Instead, long term sustained investment in local and national public health systems must be a key priority in the post-covid national recovery.
Have just finished reading the plan.

Aside from the continued roll out of local contact tracing, the T&T improvement is entirely focused on scaling up testing. Entirely.

I know there are lots of people working really hard on this, I just hope they're being listened to.
Read 4 tweets
19 Nov
Week 24 Test & Trace data summary. 05/11/20 – 11/11/20.

After two weeks of improvement, performance has stalled whilst the number of people testing positive continues to rise.

As ever, summary in pictures, detail in thread👇

gov.uk/government/pub… ImageImageImageImage
12% increase in people getting tested which is good (now 1.74m in a week(!)), but note from 6th Nov, pillar 2 now includes people having the rapid lateral flow tests (e.g. Liverpool pilot) and this will only increase in numbers.
The knock-on impact is lower P2 positivity rates. ImageImageImage
The implications of this is that it makes it far harder to interpret positivity rates, esp if you don't separate out test device, or asymptomatic vs symptomatic testing.
Read 19 tweets
19 Nov
Latest PHE flu & COVID surveillance report, up to 15th Nov.

- ⬆️Case rates in over 70yrs.
- ⬆️hospitalisations, ICU admissions & deaths.
- Big variation by region, ethnicity, age, and deprivation.
- (+ some good news on flu & flu jabs)

gov.uk/government/sta…
Confirmed cases of COVID plateaued this week, and positivity rates dropping.

Still probably a little early to see results of 6th Nov restrictions, but local restrictions likely important. And new use of lateral flow tests (pillar 2) may be contributing to lower positivity rates.
And case rates falling across most aged but crucially NOT among age 70yrs+
Read 15 tweets
18 Nov
Irrespective of the fact that 50,000 of 5,000,000 is 1% rather than 0.1%, here's a v short selection of data that might help to clarify some of the differences between flu and COVID-19.

Short thread.
Fortunately, @PHE_uk have a flu surveillance programme.

Over past 5yrs, the worst flu season saw an estimated 22k deaths in Eng (2017/18).

So far ONS have recorded 55k deaths including COVID. Gov.uk estimate 46k.

It's not yet December.

assets.publishing.service.gov.uk/government/upl…
Hospital admission rates from flu in the past five years peaked in 2017/18 at around 10/100,000.

In the first week of November, it was already >14/100,000 and >25/100,000 in the NE.
Read 5 tweets
12 Nov
Week 23 Test & Trace data summary. 29/10/20 – 04/11/20.

It's getting better but there's still a way to go.

Summary in pictures, detail in thread 👇

gov.uk/government/pub… Image
>1.5m people tested this week, 2% more than last week.

So whilst testing capacity's grown, it's not translating into more people being tested.

Number of positives up 8% as well to 149,253, across both pillar 1 and pillar 2. ImageImageImageImage
So despite more capacity, positivity ⬆️this wk (to 11.5% in P2, 5.1% in P1). Although today's PHE data suggests this rise may be stalling.

And still not separating symptomatic vs non-symptomatic testing, plus these results are before L'pool mass testing. ImageImage
Read 15 tweets

Did Thread Reader help you today?

Support us! We are indie developers!


This site is made by just two indie developers on a laptop doing marketing, support and development! Read more about the story.

Become a Premium Member ($3/month or $30/year) and get exclusive features!

Become Premium

Too expensive? Make a small donation by buying us coffee ($5) or help with server cost ($10)

Donate via Paypal Become our Patreon

Thank you for your support!

Follow Us on Twitter!