ICYMI, today the gov launched the COVID Winter Plan.
It includes an additional £7bn for Test & Trace, who's budget now stands at £22bn.
The comparison with PHE's entire budget is old news. But in case it helps, it was £300m.
gov.uk/government/pub…
It includes an additional £7bn for Test & Trace, who's budget now stands at £22bn.
The comparison with PHE's entire budget is old news. But in case it helps, it was £300m.
gov.uk/government/pub…

There can surely be very little argument left against reversing long term cuts to public health budgets.
Instead, long term sustained investment in local and national public health systems must be a key priority in the post-covid national recovery.
Instead, long term sustained investment in local and national public health systems must be a key priority in the post-covid national recovery.
Have just finished reading the plan.
Aside from the continued roll out of local contact tracing, the T&T improvement is entirely focused on scaling up testing. Entirely.
I know there are lots of people working really hard on this, I just hope they're being listened to.
Aside from the continued roll out of local contact tracing, the T&T improvement is entirely focused on scaling up testing. Entirely.
I know there are lots of people working really hard on this, I just hope they're being listened to.
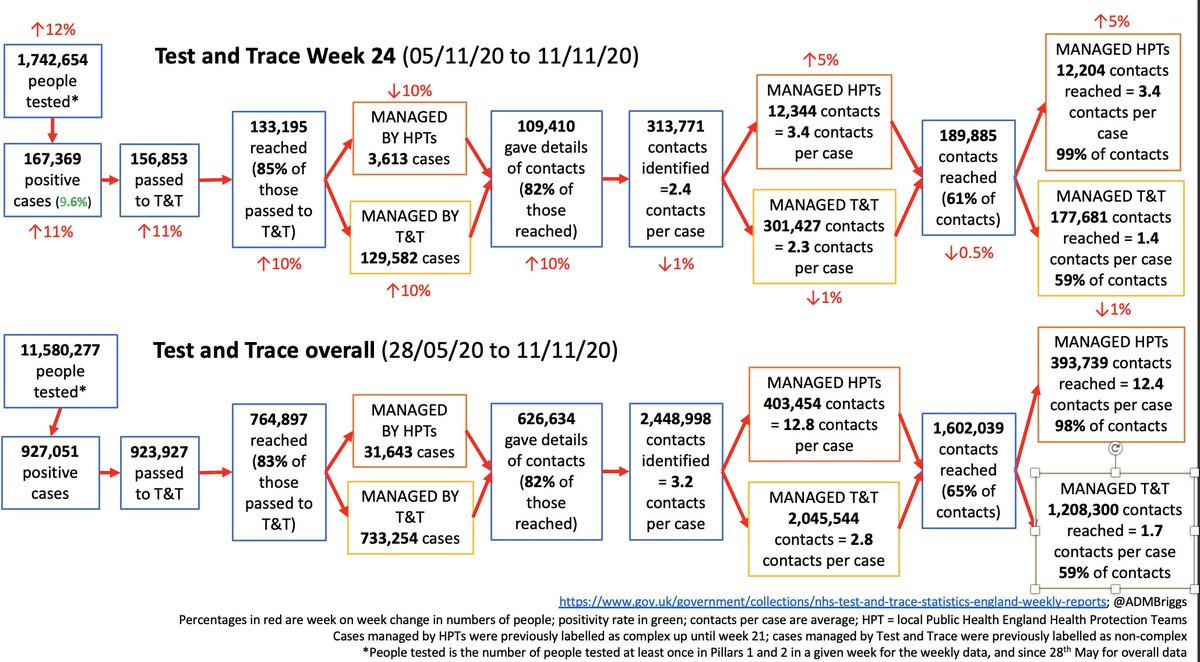
By 'this', I mean contact tracing. Here's the relevant paragraphs that cover it in amongst the 112 paragraphs of the plan.

• • •
Missing some Tweet in this thread? You can try to
force a refresh