Thread: Parabolic SAR Indicator
Parabolic SAR (PSAR) indicator was developed by J. Welles Wilder.
#PSAR #Indicators #Definedge
Parabolic SAR (PSAR) indicator was developed by J. Welles Wilder.
#PSAR #Indicators #Definedge
The calculation of this indicator is a bit complex, but the concept is extremely useful. I will try to simplify it and explain the logic. I will briefly explain the concept, calculation and reading.
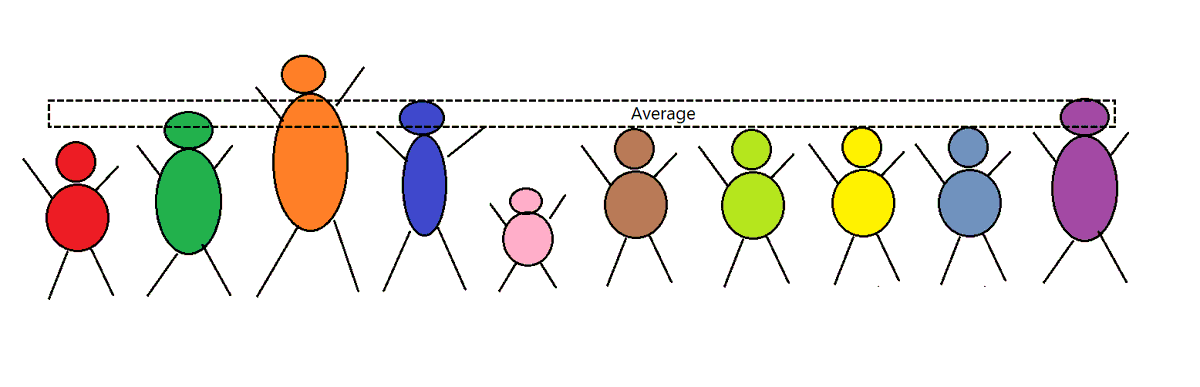
Let us think about creating an indicator that shows the trend.
Let us think about creating an indicator that shows the trend.
Using the indicator, we can identify & ride the trend using the trailing stop-loss method.
For trailing the stop in uptrend, indicator needs to be placed below the candle. Similarly, it should be placed above the candle for trailing in a downtrend. We will plot it using ‘dots’.
For trailing the stop in uptrend, indicator needs to be placed below the candle. Similarly, it should be placed above the candle for trailing in a downtrend. We will plot it using ‘dots’.
So, the indicator & stop-loss will be rising in uptrend & falling in downtrend.
Let us define the trend as:
If Low of the candle > Stop-loss level in bull market = Trend remains bullish.
If High of the candle < Stop-loss level in bear market = Trend is bearish
Let us define the trend as:
If Low of the candle > Stop-loss level in bull market = Trend remains bullish.
If High of the candle < Stop-loss level in bear market = Trend is bearish
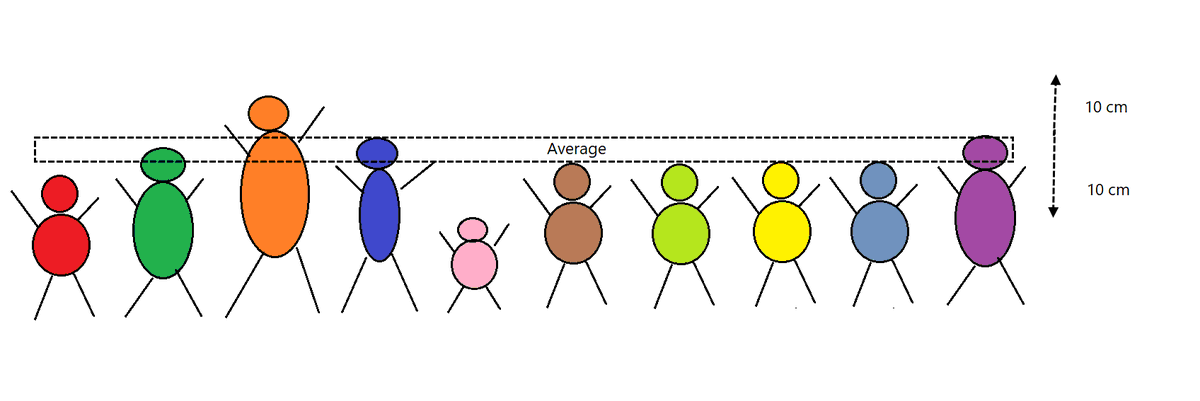
Imagine you are driving a car on highway; you would like to accelerate if the road is clear. You will slow down if the road is bumpy.

Same concept is applied here.
The indicator rises steadily if the trend is steady. If the trend is strong the indicator should accelerate, it should move faster and stop should get trailed aggressively.
What is strong trend?
The indicator rises steadily if the trend is steady. If the trend is strong the indicator should accelerate, it should move faster and stop should get trailed aggressively.
What is strong trend?
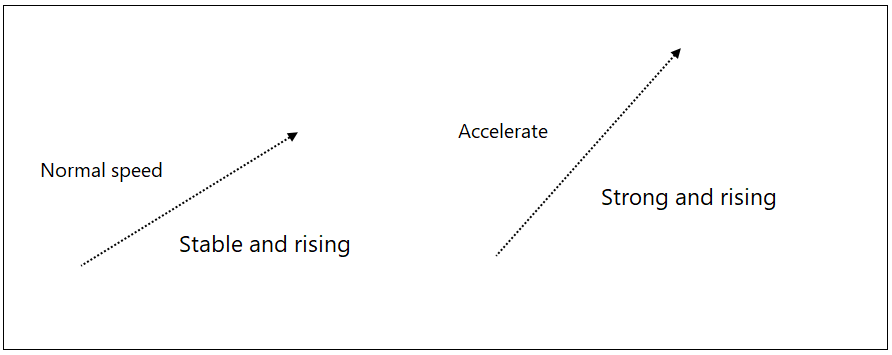
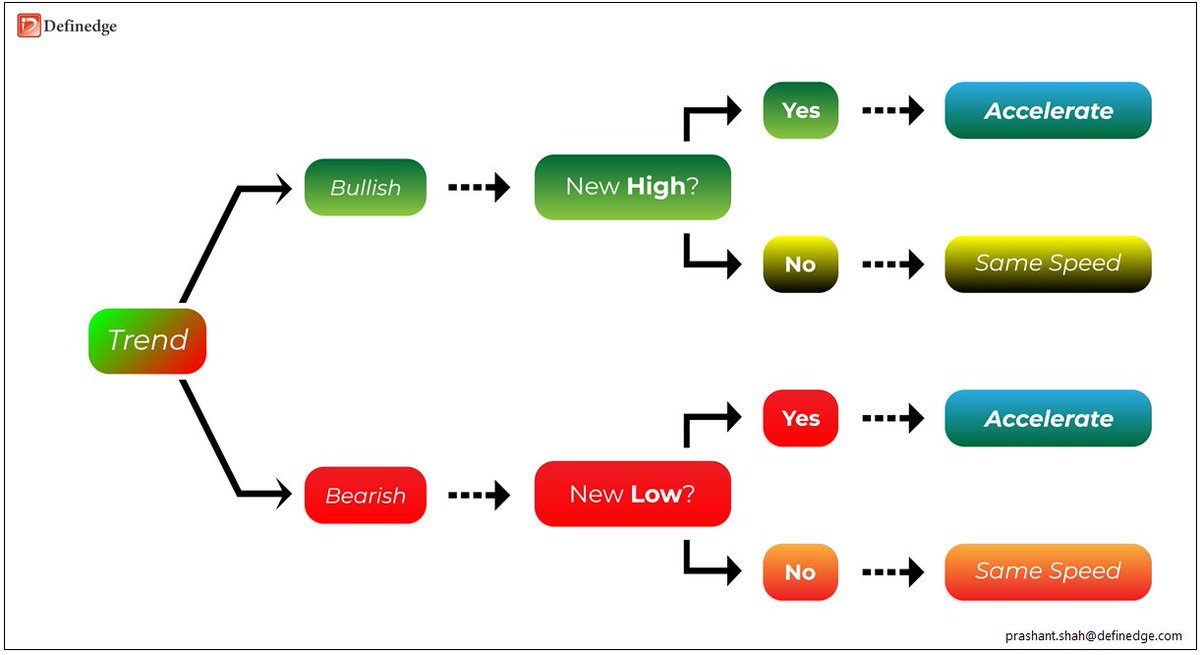
Strong?
In a bullish trend if price makes a new high it is a strong bullish trend.
In a bearish trend, if price makes a new low it is a strong bearish trend.
Period?
Period for new high: since the indicator turned bullish
Period for new low: since the indicator turned bearish
In a bullish trend if price makes a new high it is a strong bullish trend.
In a bearish trend, if price makes a new low it is a strong bearish trend.
Period?
Period for new high: since the indicator turned bullish
Period for new low: since the indicator turned bearish
Hope concept is clear.
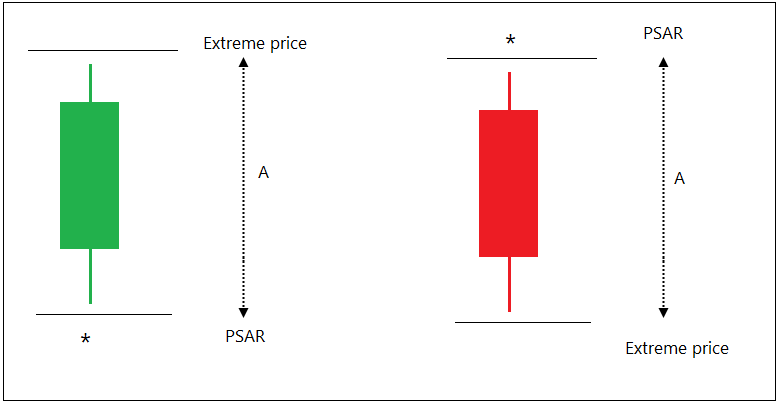
Calculation of PSAR: EP, AF and PSAR
Extreme Price (EP) is calculated on every candle.
‘High’ price in bullish market and ‘Low’ price in bearish market is called as Extreme Price (EP).
Calculation of PSAR: EP, AF and PSAR
Extreme Price (EP) is calculated on every candle.
‘High’ price in bullish market and ‘Low’ price in bearish market is called as Extreme Price (EP).
If Bullish trend:
If new high is made -> EP = New High price
Else
EP = Prev High
If Bearish trend
If new low is made -> EP = New Low price
Else
EP = Prev Low
Period of new high or low is explained earlier.
If new high is made -> EP = New High price
Else
EP = Prev High
If Bearish trend
If new low is made -> EP = New Low price
Else
EP = Prev Low
Period of new high or low is explained earlier.
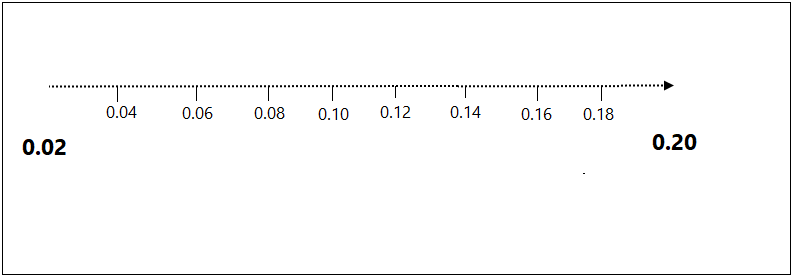
Wilder created a method of calculating Acceleration Factor (AF) for the indicator:
> Accelerate it by 0.02 if trend is steady.
> Add 0.02 to previous speed if trend is strong.
> Maximum acceleration will be 0.20.
> Accelerate it by 0.02 if trend is steady.
> Add 0.02 to previous speed if trend is strong.
> Maximum acceleration will be 0.20.
A = Different between extreme price and PSAR indicator price
Multiply Acceleration factor by A and add it to the previous stop-loss, you get new PSAR indicator reading.
PSAR = A x AF + Previous PSAR reading
Multiply Acceleration factor by A and add it to the previous stop-loss, you get new PSAR indicator reading.
PSAR = A x AF + Previous PSAR reading
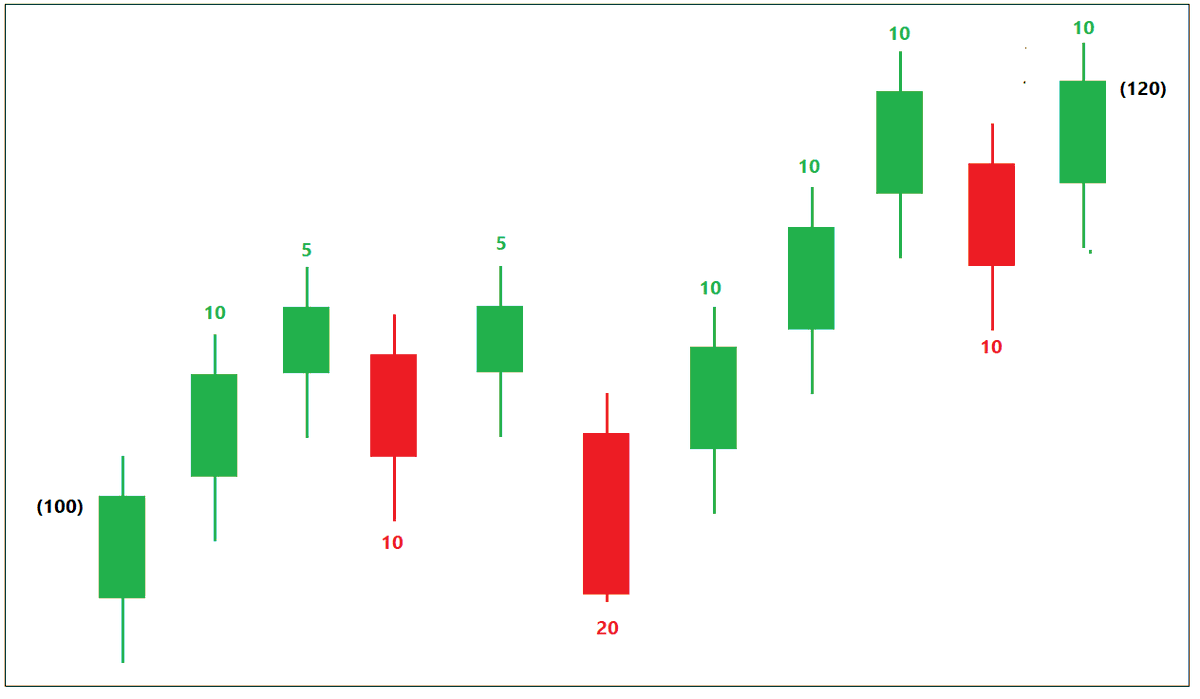
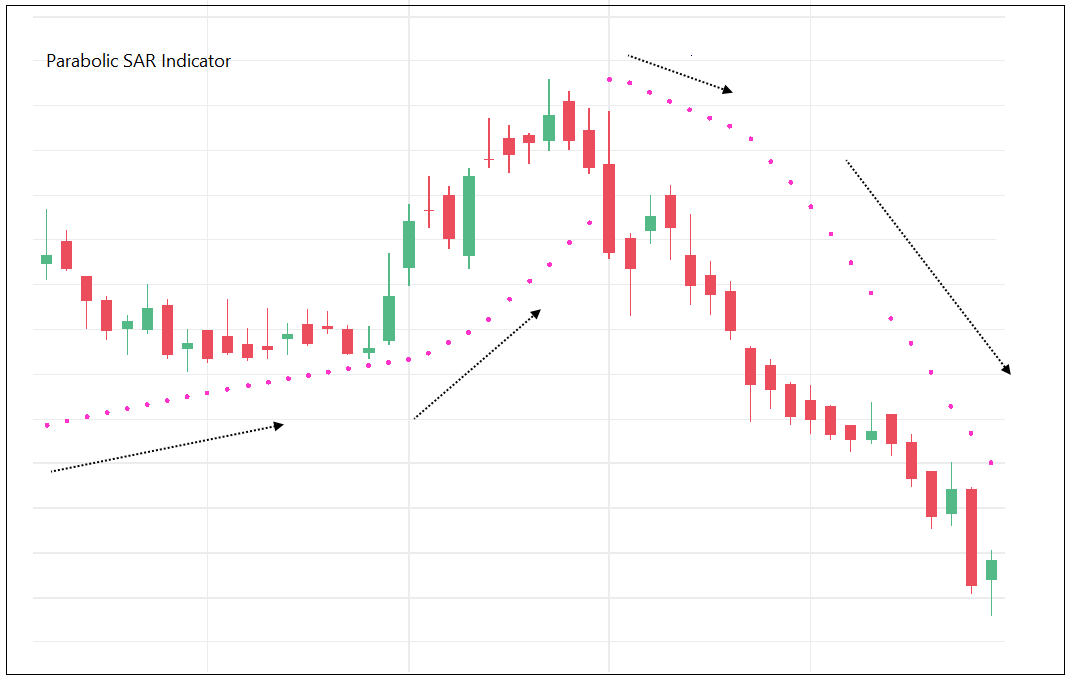
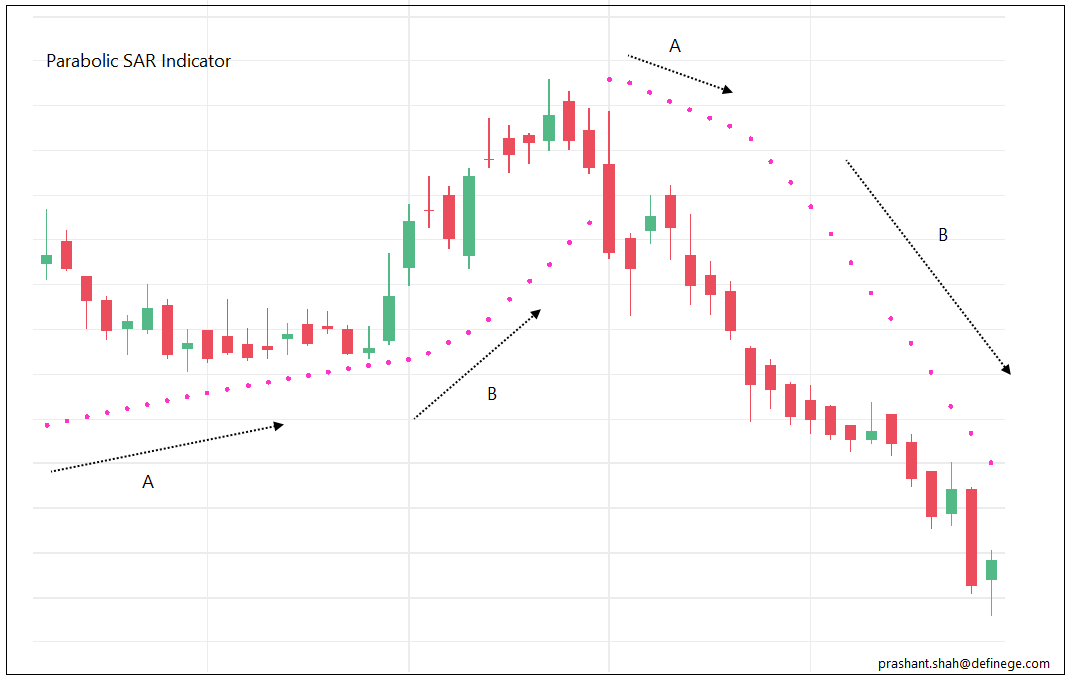
Have a look at below image. Pink dots show PSAR indicator.
Phase A is when indicator moving at a steady speed. Phase B is when trend is strong (New high in bull market, new low in bear market) hence, PSAR is accelerating with a greater speed (0.02 being added) during B.
Phase A is when indicator moving at a steady speed. Phase B is when trend is strong (New high in bull market, new low in bear market) hence, PSAR is accelerating with a greater speed (0.02 being added) during B.
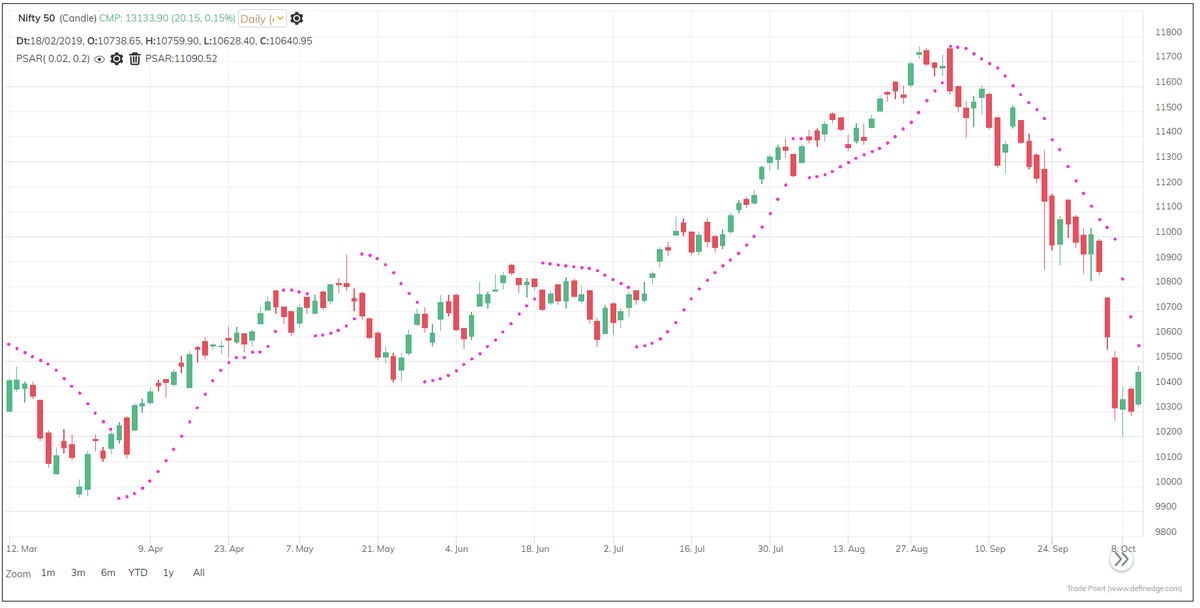
So, the basic reading of the indicator is:
Trend is bullish when price is above the PSAR, it is bearish when price is below PSAR. You can use it as a trend filtration method.
Indicator accelerates during strong trends. Hence, rising PSAR and Falling PSAR are also important.
Trend is bullish when price is above the PSAR, it is bearish when price is below PSAR. You can use it as a trend filtration method.
Indicator accelerates during strong trends. Hence, rising PSAR and Falling PSAR are also important.
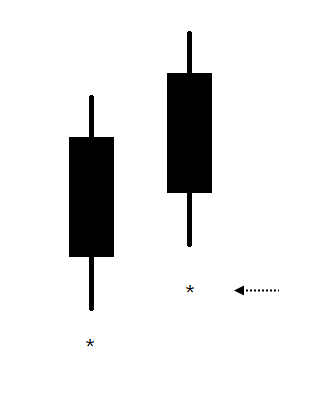
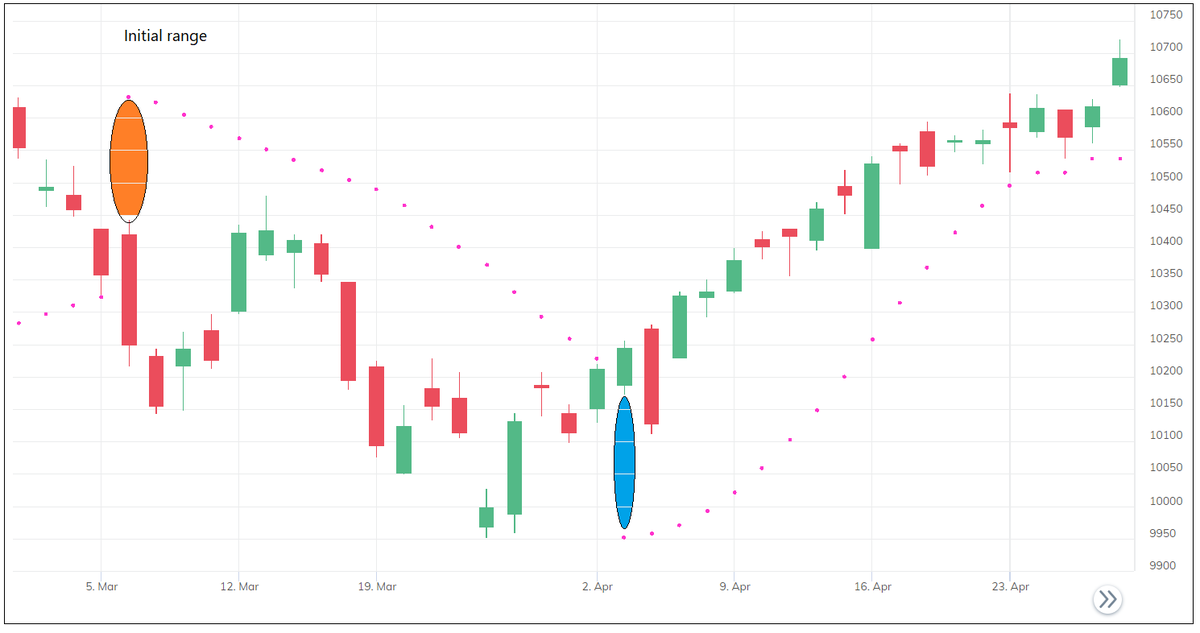
The indicator is also used as a Stop & Reverse (SAR) trading system.
When trend changes, the length of the stop-loss depends on the previous high or low. Avoid the signal if initial stop-loss is not affordable. Wait for the pullback pattern that provides better risk-reward trade
When trend changes, the length of the stop-loss depends on the previous high or low. Avoid the signal if initial stop-loss is not affordable. Wait for the pullback pattern that provides better risk-reward trade
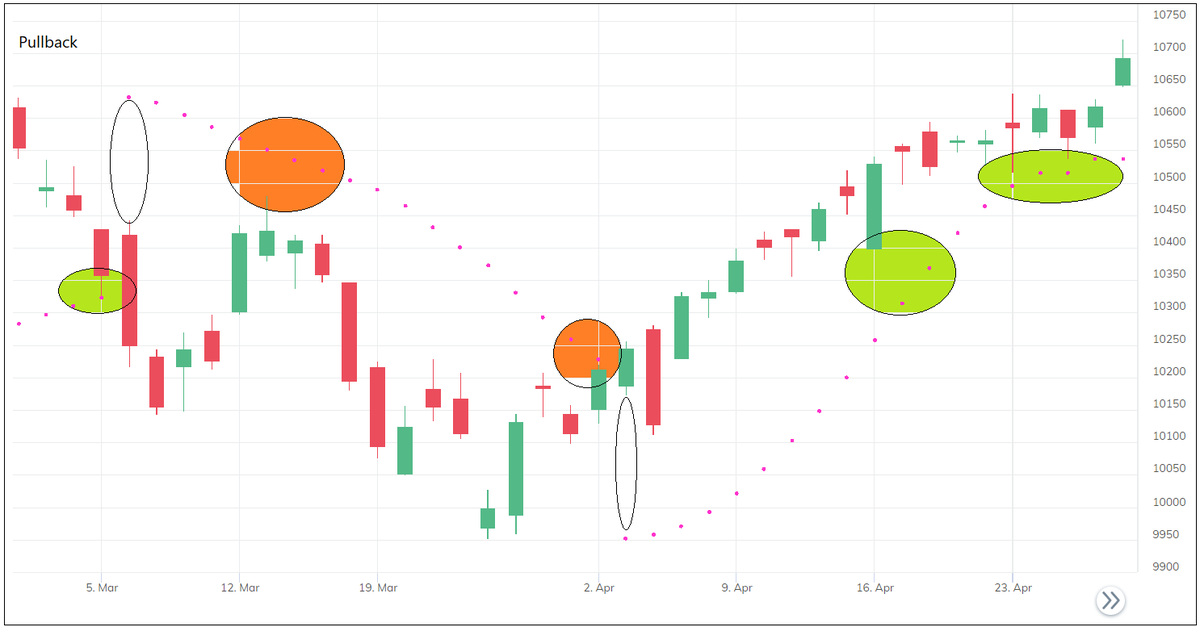
I wouldn’t say PSAR is a good sup-res indicator because it’s a mathematical calc. But it offers pullback trade opportunity with better risk-reward when price comes near the indicator during strong trends.
It can be used alone or combined with other studies to design the system.
It can be used alone or combined with other studies to design the system.
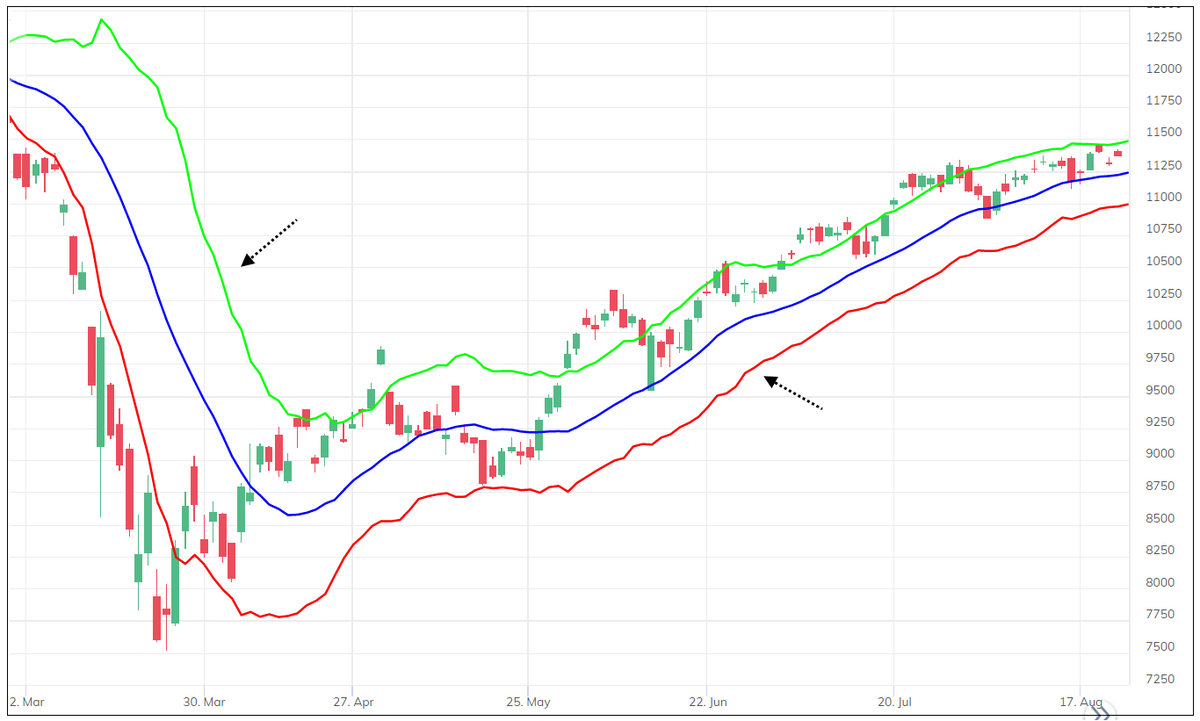
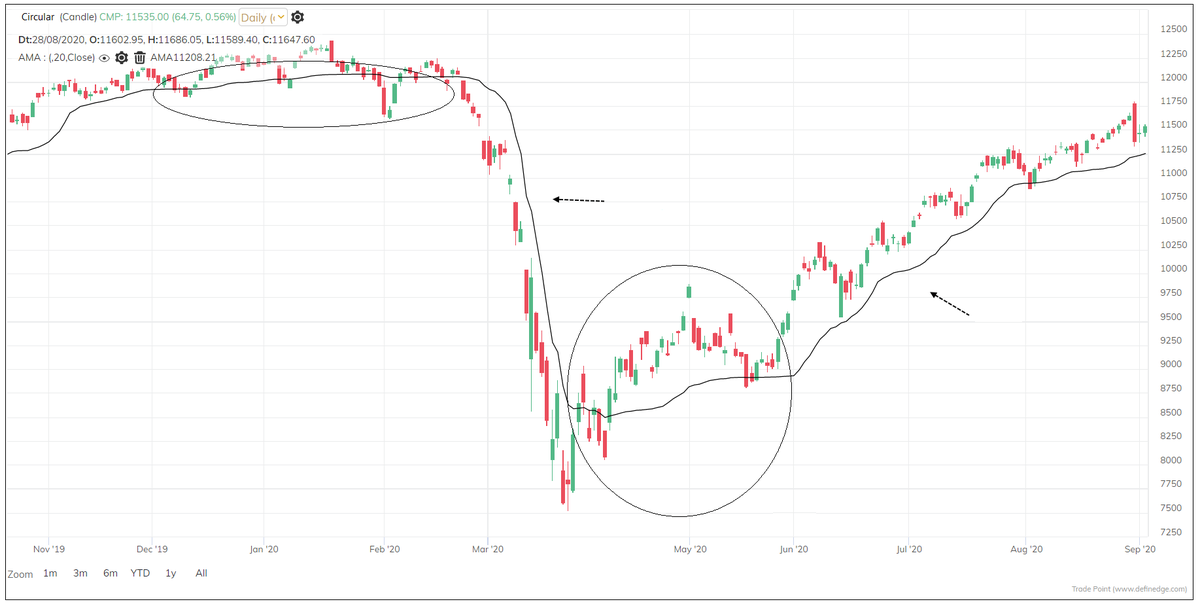
We discussed about AMA and Super trend indicator which uses similar concept. They go flat when trend is not strong. PSAR increases steadily if trend is not strong and moves fast when it is strong.
Below are some Important things about PSAR indictor:
Below are some Important things about PSAR indictor:
Imp features:
• Unlike many other indicators, you do not have to define the look-back period, define the acceleration factor
• It does not use method of averaging
• It uses high, low prices to determine the trend and stop-loss level
• Indicator accelerates if trend is strong
• Unlike many other indicators, you do not have to define the look-back period, define the acceleration factor
• It does not use method of averaging
• It uses high, low prices to determine the trend and stop-loss level
• Indicator accelerates if trend is strong
Indicator is useful & applicable on different timeframes. 0.02 and 0.20 are recommended settings to being with. I like to explore it on Noiseless charts, objective price patterns are advantage there. Change max AF to 0.10 if you want to use it in Renko. I will talk more about it.
Is it a ‘leading’ or ‘best’ indicator? Its different & useful. ‘Leading’ comes at a cost, ‘Lagging’ can b useful as well. Major issue wid learning in d field of trading is that everything is associated wid trading it immediately. Focusing on concept would bring long-term success!
• • •
Missing some Tweet in this thread? You can try to
force a refresh