There has been a significant question about the degree to which Thanksgiving holiday and associated travel and social gatherings may have contributed to transmission of #COVID19. Here I try to briefly address this question. 1/8
Based on known incubation periods (nejm.org/doi/full/10.10…), we expect, on one end, some infections arising on Nov 26 to become symptomatic on Nov 30 and on the other end, for some infections arising on Nov 30 to become symptomatic on Dec 6. 2/8
This brackets the window where we expect most of the increased case load to be. However, most states only list cases based on date of report rather than date the case became symptomatic. This causes jitter that's hard to deal with when looking for a Thanksgiving effect. 3/8
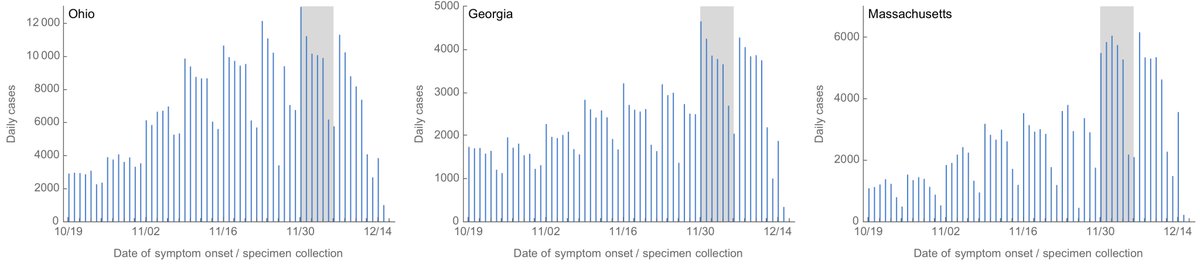
I focus on states reporting cases based on symptom onset (or specimen collection when symptom onset is not available), were I found Ohio (coronavirus.ohio.gov/wps/portal/gov…), Georgia (dph.georgia.gov/covid-19-daily…) and Massachusetts (mass.gov/info-details/c…) with data available for download. 4/8
If we plot cases by symptom onset / specimen collection date and highlight the expected window of Nov 30 to Dec 6 we get the following, where there appears to be a bump in cases in this expected window of time. 5/8
This can perhaps be seen more clearly by plotting weekly total cases leading up to the 7-day period of Nov 30 to Dec 6. Here, it's very clear that there is bump in case counts in the week following Thanksgiving (marked by dashed line). 6/8
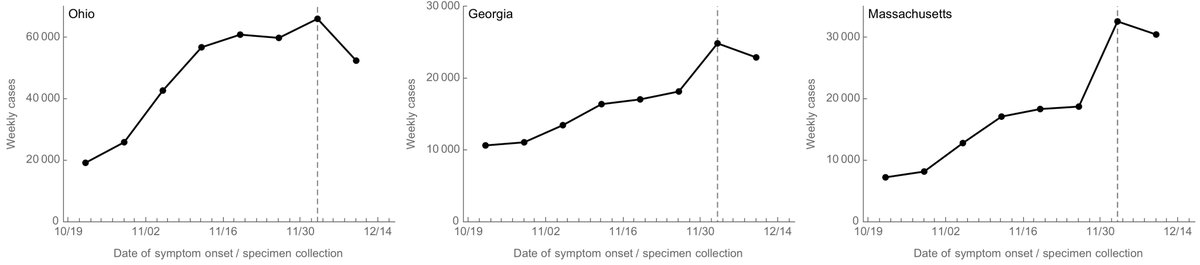
This ranges from an 11% bump for Ohio, a 23% bump for Georgia and a 41% bump for Massachusetts, based on comparison to a linear extrapolation from the 2 previous weeks. 7/8
The week with symptom onset between Dec 7 to Dec 13 has not completely filled in yet, and so the apparent drop after Thanksgiving week may become less sharp as data continues to fill in. 8/8

• • •

Missing some Tweet in this thread? You can try to force a refresh
 

Keep Current with Trevor Bedford

Trevor Bedford Profile picture

Stay in touch and get notified when new unrolls are available from this author!

Read all threads

This Thread may be Removed Anytime!

PDF

Twitter may remove this content at anytime! Save it as PDF for later use!

Try unrolling a thread yourself!

how to unroll video
  1. Follow @ThreadReaderApp to mention us!

  2. From a Twitter thread mention us with a keyword "unroll"
@threadreaderapp unroll

Practice here first or read more on our help page!

More from @trvrb

19 Dec
With #COVID19 vaccine efficacy of ~95%, I'm looking forward to vaccine distribution in 2021 bringing the pandemic under control. However, I'm concerned that we'll see antigenic drift of SARS-CoV-2 and may need to update the strain used in the vaccine with some regularity. 1/18
First, some background. RNA viruses all evolve extremely rapidly, but some like influenza are able to accept mutations to their surface proteins in such a way that they can partially escape human immunity. This process is known as "antigenic drift". 2/18
For influenza, this necessitates regular vaccine updates to keep up with an evolving virus population. Other RNA viruses like measles mutate quickly but are unable to change protein structure to escape from immunity and so these vaccines don't need updating. 3/18
Read 18 tweets
12 Dec
Although the US is continuing to hit records for daily #COVID19 cases reported, the rate of exponential growth has slowed. Mortality is still catching up to increased case loads and I expect daily deaths reported to further increase. 1/8
This plot summarizes the overall picture. Bubble size is proportional to daily cases per capita from @COVID19Tracking and bubble color shows Rt from rt.live. Timepoints are shown up to two weeks ago due to delay in reliable estimates of Rt. 2/8
The Midwest and Mountain West had rapid growth during October resulting in large epidemics in November, but they're now starting to plateau or decline in incidence. Although current incidence is lower, the epidemic is still growing in much of the East Coast. 3/8
Read 8 tweets
10 Dec
The US reported over 3000 deaths from #COVID19 today and the 7-day average of deaths has hit a record with today's average of 2276. Here, I dig into these grim mortality numbers and look at deaths across ages and across weeks in the epidemic. 1/14
I'm using data from @CDCgov (cdc.gov/nchs/nvss/vsrr…) that records weekly deaths involving COVID-19 as well as deaths from all causes. These data use actual date of death but there is a reporting lag. 2/14
CDC reports 261k deaths involving COVID-19 in this dataset. Over half of these deaths are in individuals 75 or older and over three quarters are in individuals 65 or older. 3/14
Read 14 tweets
4 Dec
The US is reporting over 2000 deaths per day from Dec 1 and I believe will do so consistently throughout December based on daily case loads above 120k starting early November. 1/4
A drop in reporting over Thanksgiving weekend has made for some difficulty in directly comparing 7-day averaged deaths, but the trend is clear. Red bars are daily reported deaths from @COVID19Tracking and black line is 7-day sliding average. 2/4
The simple projection of 1.7% of reported cases into deaths 22 days later has remained largely accurate, although drop of reporting during Thanksgiving weekend is quite clear. We'll know soon whether 7-day average returns back to projection. 3/4
Read 4 tweets
1 Dec
I don't think that this study by Basavaraju et al from @CDCgov can be taken as evidence that #COVID19 was circulating in the US in December 2019. 1/10
academic.oup.com/cid/advance-ar…
The authors do a careful serological investigation, but it necessarily suffers from testing a large number of samples with an assay that is not perfectly specific. 2/10
The ELISA used by the authors has a stated specificity of 99.3% and the authors tested 519 "true negative" blood samples collected from 2016 to 2019 from healthy adults and suspected hanta virus patients and observed 3 false positives (0.6%) matching this specificity. 3/10
Read 12 tweets
26 Nov
Another update on #COVID19 circulation in the US. With today's report we're seeing an average of ~172k daily cases reported compared to ~157k a week ago, and we're seeing ~1650 daily deaths reported compared to ~1200 a week ago. 1/10
Although this is still a staggering amount of cases and growing daily, the rate of growth at the US level appears to be (at least temporarily) slowing. Here, I've plotted data from @COVID19Tracking, showing daily cases in the US on a log scale alongside 7-day moving average. 2/10
Throughout October we saw steady exponential growth of the US epidemic (indicated by linear-on-a-log-scale dynamics and shown in the graph as the dashed straight line). Early November outpaced this steady growth but has recently slowed. 3/10
Read 10 tweets

Did Thread Reader help you today?

Support us! We are indie developers!


This site is made by just two indie developers on a laptop doing marketing, support and development! Read more about the story.

Become a Premium Member ($3/month or $30/year) and get exclusive features!

Become Premium

Too expensive? Make a small donation by buying us coffee ($5) or help with server cost ($10)

Donate via Paypal Become our Patreon

Thank you for your support!

Follow Us on Twitter!