
With #COVID19 vaccine efficacy of ~95%, I'm looking forward to vaccine distribution in 2021 bringing the pandemic under control. However, I'm concerned that we'll see antigenic drift of SARS-CoV-2 and may need to update the strain used in the vaccine with some regularity. 1/18
First, some background. RNA viruses all evolve extremely rapidly, but some like influenza are able to accept mutations to their surface proteins in such a way that they can partially escape human immunity. This process is known as "antigenic drift". 2/18
For influenza, this necessitates regular vaccine updates to keep up with an evolving virus population. Other RNA viruses like measles mutate quickly but are unable to change protein structure to escape from immunity and so these vaccines don't need updating. 3/18
There has been an open question to the degree to which SARS-CoV-2 will behave like influenza and require vaccine updates. However, emerging evidence suggests that antigenic drift is likely. 4/18
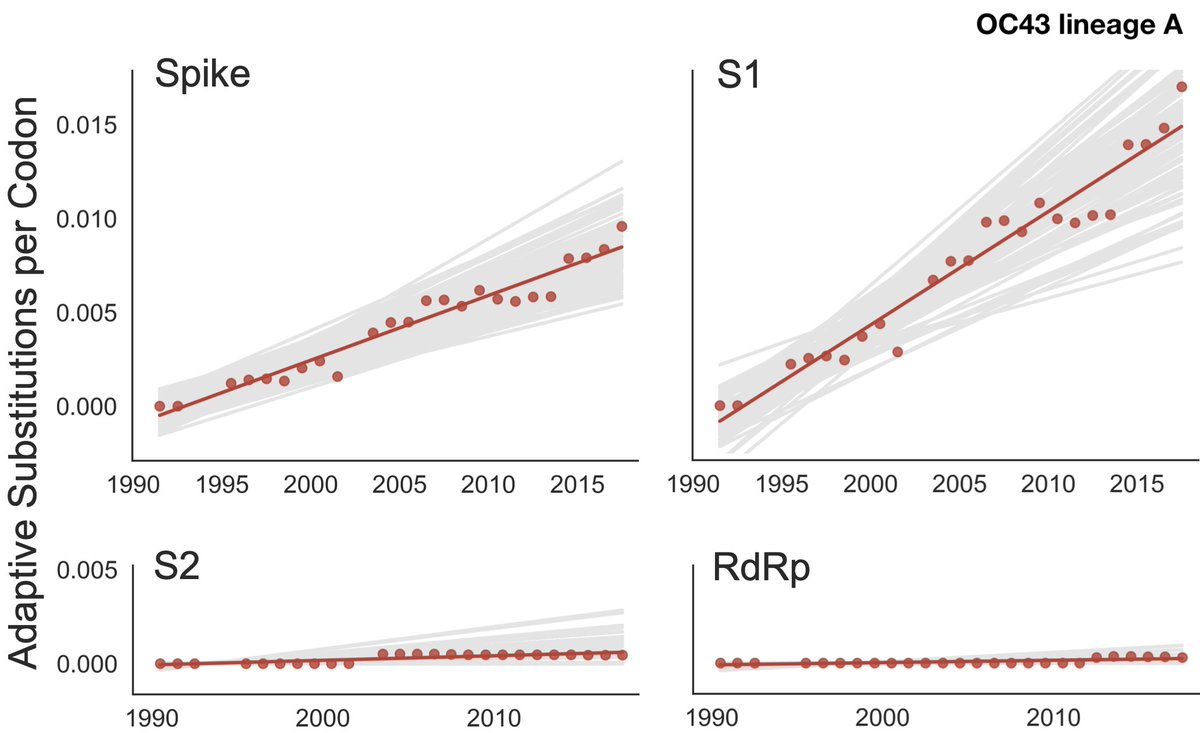
First off, we have new studies on antigenic drift in seasonal coronaviruses. Katie Kistler and I have shown abundant adaptive evolution in the spike proteins of viruses OC43 and 229E consistent with antigenic drift (bedford.io/papers/kistler…). 5/18 
We also now have direct serological evidence of antigenic drift in 229E from @eguia_rachel, @jbloom_lab et al, suggesting that reinfection by seasonal coronaviruses that occurs every ~3 years is in part due to evolution of the virus. 6/18
https://twitter.com/jbloom_lab/status/1339939720558563328
For SARS-CoV-2, we only expect antigenic variants to spread once enough people have been infected to give these variants a transmission advantage gained by the ability to reinfect some portion of individuals immune to the original variant. 7/18
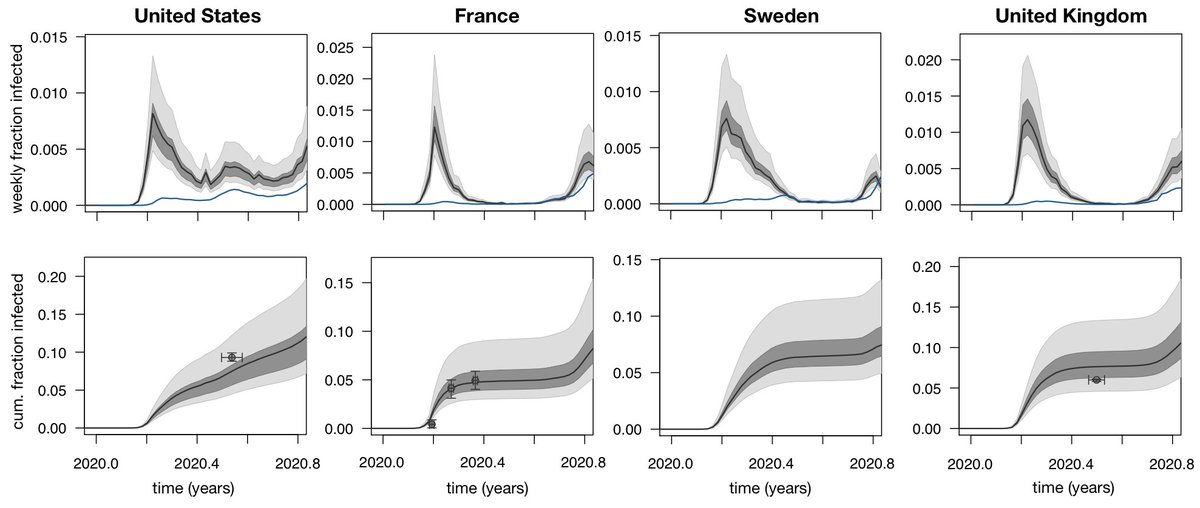
At this point, many countries have had perhaps 10% to 20% of their population infected (medrxiv.org/content/10.110…), and so we expect some weak evolutionary pressure for antigenic drift. 8/18 
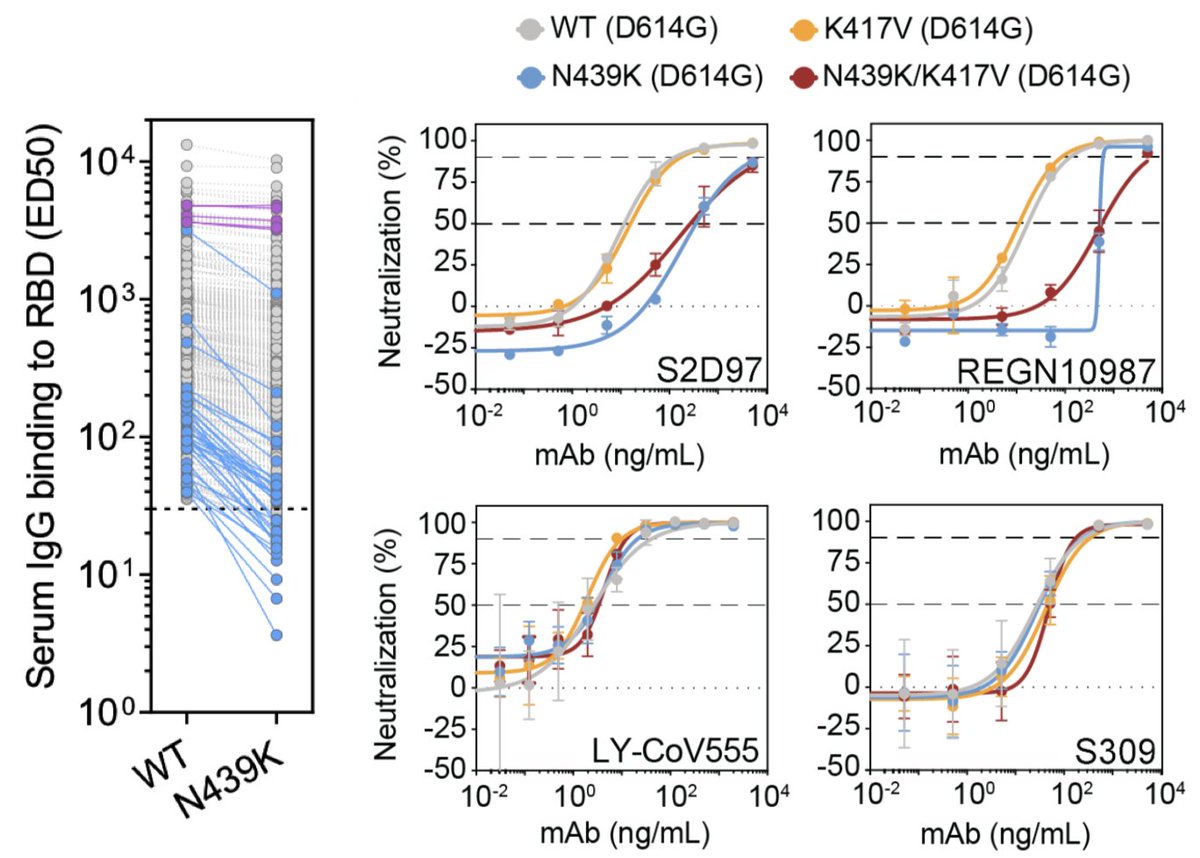
We've now seen the emergence and spread of several variants that may have some antigenic impact. These variants are generally labeled based on the mutation to the SARS-CoV-2 spike protein. For example N439K has a change from asparagine (N) to lysine (K) at site 439 in spike. 9/18
This variant N439K is now present in ~5% of recent viruses from Europe (nextstrain.org/ncov/europe?c=…) and shows evidence of escape from some monoclonal antibodies and decreased reactivity to some convalescent sera (@emcat1, @robertson_lab et al biorxiv.org/content/10.110…). 10/18 
Recent announcements have focused on spread of N501Y in the UK (
https://twitter.com/CovidGenomicsUK/status/1338580111986204672) and independent emergence and spread of N501Y in South Africa (
https://twitter.com/DrZweliMkhize/status/1339970259332325383). 11/18
The UK variant in particular has several mutations that are of biological interest and deserves close attention (@arambaut, @pathogenomenick et al virological.org/t/preliminary-…). 12/18
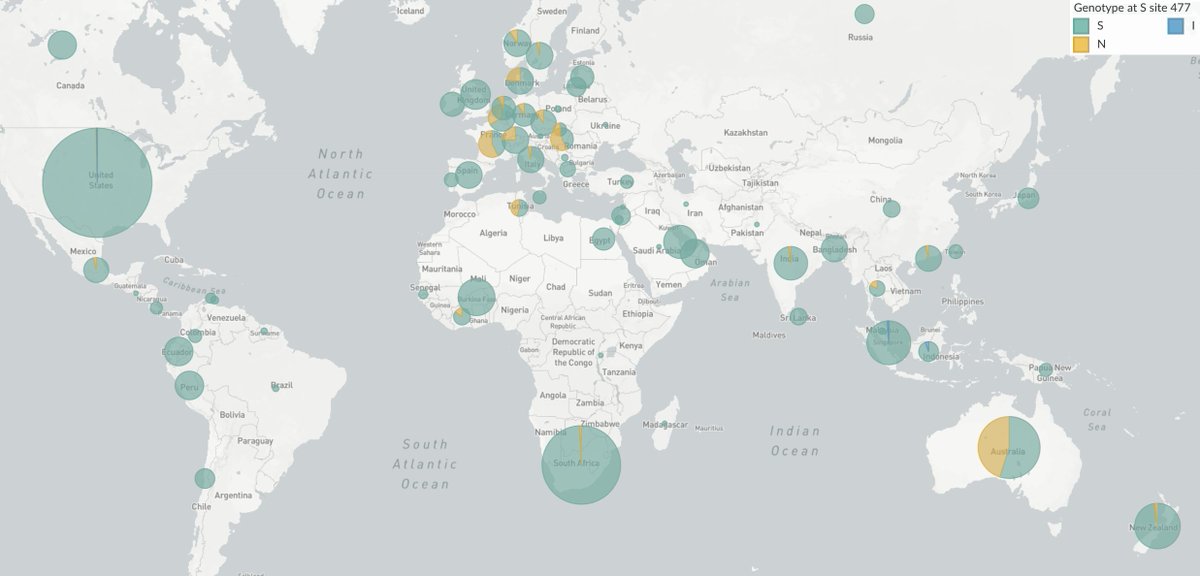
Independent emergence and spread of variants is suggestive of natural selection where in addition to N501Y we see for example S477N emerging independently in Europe (nextstrain.org/ncov/europe?c=…) and in Australia (nextstrain.org/ncov/oceania?c…). 13/18 
@firefoxx66 is maintaining a list of mutations of interest with associated @nextstrain views and relevant publications at github.com/emmahodcroft/c…. 14/18
All this said, I'm not concerned that these variants will significantly reduce vaccine efficacy in the 2021 rollout. Most circulating SARS-CoV-2 viruses do not have any mutations in the spike receptor binding domain (nextstrain.org/ncov/global?c=…). 15/18 
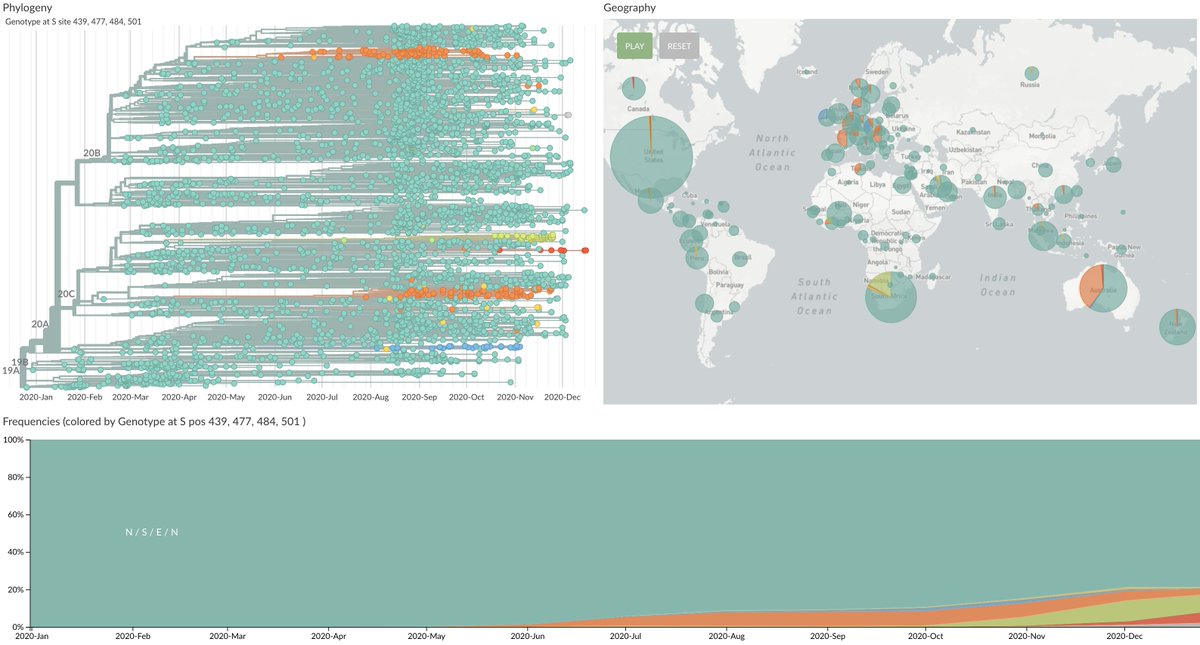
Additionally, single mutations will generally have small impacts on polyclonal immune responses and the strong immune response to the mRNA vaccines would suggest that a large antigenic change would be needed to significantly reduce efficacy. 16/18
https://twitter.com/trvrb/status/1328584239789568000
However, we may see modest reductions in vaccine efficacy due to antigenic drift and will likely need a process in the coming years by which we update the spike variant used in the vaccine to best match circulating viruses. 17/18
Going forward, I suggest:
1. Emerging variants should be assayed against sera from recovered and vaccinated individuals to test for antigenic effects
2. Immunization records should be connected to genomic surveillance to identify variants involved in breakthrough infections
18/18
1. Emerging variants should be assayed against sera from recovered and vaccinated individuals to test for antigenic effects
2. Immunization records should be connected to genomic surveillance to identify variants involved in breakthrough infections
18/18
• • •
Missing some Tweet in this thread? You can try to
force a refresh


