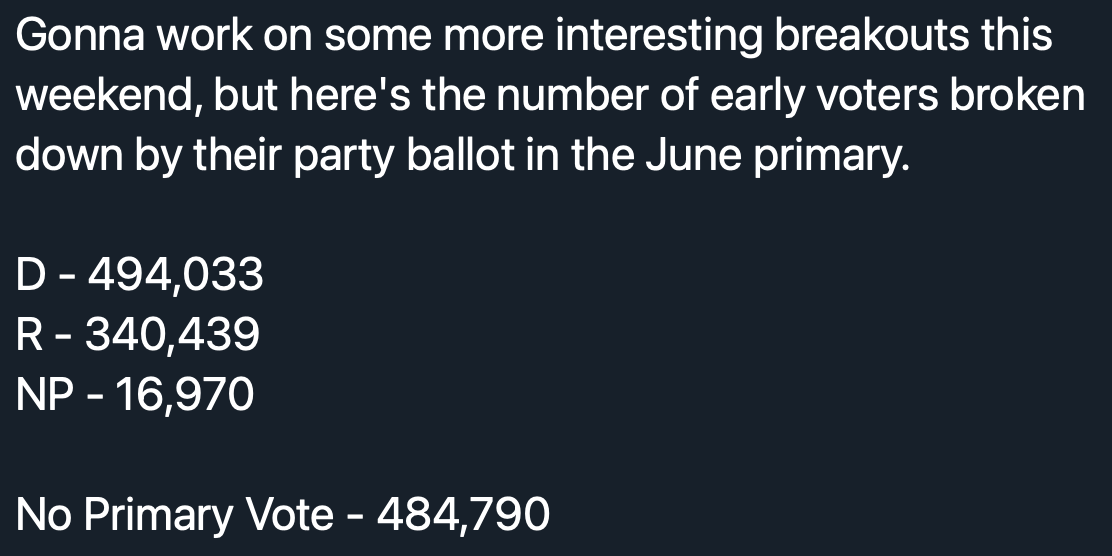
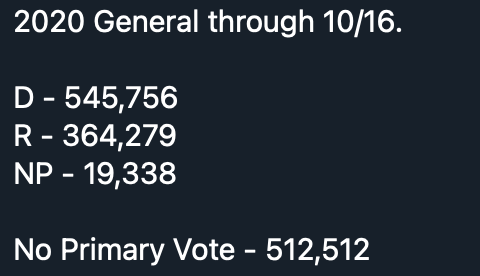
Ok, as promised I dug into the numbers a little more. Particularly around how people voted in the 2020 primary. There are better ways to estimate overall partisanship, but I've stuck with this for now.
First, I want to let folks revisit the breakdown of D and R primary voters who have voted so far, vs the breakdown through the first week of early voting in the general.

Dem "lead" is 154k vs 181k in the general on lower overall turnout. That's about D +16% vs D +17.4%.
This also lines up with what Nate Cohn has been posting about, which looks at this a lot more thoroughly than I think I am. Dems are doing well, but not necessarily as well as they were at this point in the general.

What I want to talk about is Simpson's Paradox, which is my favorite paradox. And yes, I understand how it sounds saying I have a favorite paradox.

en.wikipedia.org/wiki/Simpson%2…
Basically a population of X can be made up of 2 kinds of things: A and B.

The averages of A and B can both go in one direction, but the overall average of X goes in the other because the portions of A and B change as well.
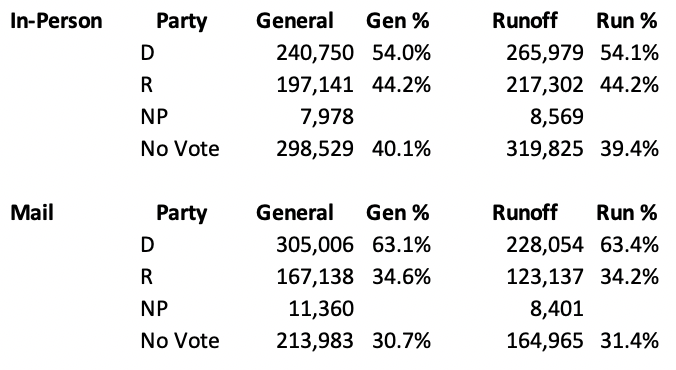
In this case, the overall Democratic performance appears to be a little down vs the general. But mail votes and in-person votes are actually both doing BETTER for Democrats than they did in the general.
Here's a table to demonstrate this a little more clearly.

D's are doing 0.1% to 0.3% better overall by each voting method, but because the percentage of in-person votes is so much higher overall it's bringing down the overall average.

Also, "no vote" numbers are pretty similar.
And that's Simpson's Paradox. I love it, and I'm not afraid to admit it.

One thing to point out is that while mail votes are down by 25% vs value in the general, applications are only down by 9%. So we may continue to see that gap close as ballots are returned and processed.

• • •

Missing some Tweet in this thread? You can try to force a refresh
 

Keep Current with Ryan Anderson

Ryan Anderson Profile picture

Stay in touch and get notified when new unrolls are available from this author!

Read all threads

This Thread may be Removed Anytime!

PDF

Twitter may remove this content at anytime! Save it as PDF for later use!

Try unrolling a thread yourself!

how to unroll video
  1. Follow @ThreadReaderApp to mention us!

  2. From a Twitter thread mention us with a keyword "unroll"
@threadreaderapp unroll

Practice here first or read more on our help page!

More from @gtryan

18 Dec
Over 1,123,000 people have cast a vote in the Senate runoff elections in Georgia. Over 30,000 of them did not vote in the general election in November.

#gapol #gapolitics

georgiavotes.com
Let's start with some demographic breakdowns. The electorate so far is much more racially diverse than we'd expect at this point, but closer to our expectations from an age perspective.

As mentioned previously, young voters tend to vote later: georgiavotes.substack.com/p/1026-who-vot…
The current electorate is just under 55% white. If we include everyone with an approved, outstanding mail ballot that number drops below 54%.

Just as a comparison, the early voting electorate in the general was 56.6% white.
Read 6 tweets
14 Dec
Welcome to the first day of early voting in Georgia's runoff election! The data is going to get a lot fuller and more interesting starting tomorrow, but today we can see where we ended up during the mail-only voting period.

#gapol #gapolitics

georgiavotes.com
Applications are up to 1.22M, within 7% of where we were for the 2020 general when in-person voting started even with much less time for people to get their applications in.
The racial breakdown for these applicants are much more non-white than what we saw in the general, when about 60% of early voters were white.

White: 53.0%
Black: 31.6%
Hispanic: 2.1%
Asian: 3.2%
Other/Unk: 10.6%
Read 6 tweets
11 Dec
Hooo baby. 46,819 votes recorded yesterday gets us up to 200,995 total votes cast in the runoff elections so far.

And next week we get to start seeing what the early in-person numbers look like too.

#gapol #gapolitics

georgiavotes.com
Now, this is a dangerous game to play but I've started looking at some numbers based on the # of applications in so far, and the results from the 2020 general election in each county for mail votes.
First, these metrics were very different for President and the 2 Senate races.

Biden won the mail vote by 398,572 votes (65/34)
Ossoff won by 333,437 (62/36)
Combined D's in the special won by 336,740 (62/36)
Read 6 tweets
10 Dec
Yesterday we recorded 32,000 more applications and 42,500 more votes. Vote by mail applications are now within 9% of the general election's total at this point.

#gapol #gapolitics

georgiavotes.com
Over 3,300 of these people didn't vote in the general election. I don't know who you are or what you were doing, but ok then.

Three times as many people who DIDN'T VOTE (3,366) have already voted, compared to people who voted on election day (1,055) and have voted by mail.
15 counties now have more mail applications in than they recorded mail votes in the general.

The top one is Sumter County (70.3%/29.1% to Biden in mail voting, 52.0%/47.2% overall).
Read 4 tweets
9 Nov
We're still waiting on more counties to start certifying their results in Georgia, but a couple more rounds of votes were reported over the weekend.

Fulton
Biden - 1,611 (71.7%)
Trump - 576 (25.6%)

Gwinnett
Biden - 280 (68.5%)
Trump - 123 (30.1%)

Calhoun
Biden - 1 (100.0%)
And there's the update! 10 more counties certified and a chunk more votes reported.

Gwinnett (certified)
Biden - 407 (58.2%)
Trump - 274 (39.2%)

Bibb
Biden - 226 (72.7%)
Trump - 77 (24.8%)

Everything Else
Biden - 81 (45.0%)
Trump - 96 (53.3%)
Little updates from another dozen counties, and we're up to 55 total counties certified (out of 159 total, for those of you not familiar with Georgia).

Results:
Biden - 138 (54.3%)
Trump - 112 (44.1%)

Margin: 10,620
Read 4 tweets
5 Nov
Ok, good afternoon everyone!

There have been a chunk of vote updates so far today, so let's go through them in a reasonable sequence.
First, some of the remaining big-sized counties:

Sumter
Biden - 815 (67.9%)
Trump - 372 (31.1%)

I expected a 530ish vote gain for Biden here, so a little underperfoming.

Putnam
Biden - 652 (47.8%)
Trump - 700 (51.3%)

I expected a 300 vote gain for Trump here, so big Biden win
Next, small updates from counties I thought were done! All of these are net wins for Biden that didn't factor into my projections.

Bartow - 129/125 (+4)
Fayette - 154/62 (+92)
Peach - 54/33 (+21)
Taylor - 83/31 (+52)
Read 19 tweets

Did Thread Reader help you today?

Support us! We are indie developers!


This site is made by just two indie developers on a laptop doing marketing, support and development! Read more about the story.

Become a Premium Member ($3/month or $30/year) and get exclusive features!

Become Premium

Too expensive? Make a small donation by buying us coffee ($5) or help with server cost ($10)

Donate via Paypal Become our Patreon

Thank you for your support!

Follow Us on Twitter!