#COVID-19 in #Tennessee: TN leads the U.S. in cases reported per population this week. This is very serious but raises an important question: How should we interpret the latest numbers? A thread … 1/ nytimes.com/live/2020/12/2…
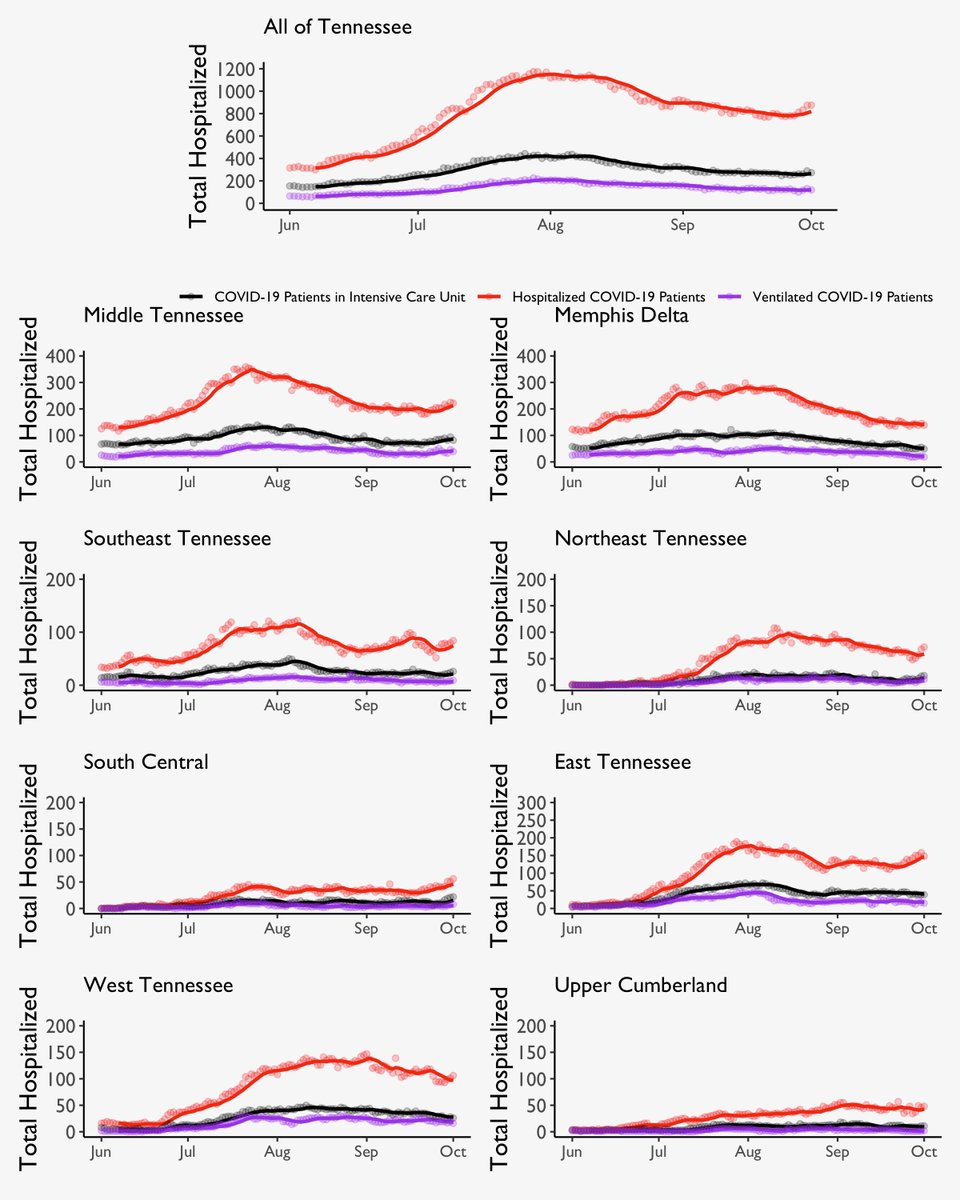
Let’s be clear on 1 thing: @TNDeptofHealth is correct that hospitals are beyond their “bend” point and quickly heading to their breaking point. We’re at 2,900 hospitalized and rising. A continued surge following the holidays will create a truly dire situation. 2/
But what about those case numbers? We’ve had several days of 11k+ reported in a single day…

Q: Are we really seeing daily case numbers that high?
A: Not quite.

We’re going to focus here on the question of *tested date vs. reported date* case numbers, not on the extent of cases that were never tested in the first place: given our high positivity rate, we know a substantial number of these exist). 4/
The last 2 weeks provides a case study in why using case numbers by date of specimen collection — rather than by date of report — is a more useful metric. 5/
As cases have grown over the ~2 weeks, the state simultaneously has been streamlining their data system to process & report test results. 6/
Leading into #Thanksgiving there were significant delays in processing. We reported this then, noting that the pandemic had receded to about 8 days in our collective “rearview mirror.” 7/
So what has happened since? First, cases did shoot up after Thanksgiving. Mondays are the day of the week with the highest number of cases, by the test date metric.

Since Thanksgiving, we’ve hit ~8-9k cases on several consecutive Mondays. 8/
But what also happened is the state caught up on reporting. Now, our collective view of the pandemic is more like 3-4 days in our rearview mirror—down from 8 just prior to Thanksgiving. 9/
As the state caught up, they were processing cases more quickly, adding to each day’s reported tally. Hence, we saw the days with 11k, 10k, etc. cases reported. 10/
Given the state seems to be caught up, they won’t be adding older cases and it will *look* like the numbers have dropped. We expect closer to an average of 5-6K per day, which is still *extremely* high, but it *will NOT necessarily be because actual case growth has slowed* 11/
The state reports weekly numbers by specimen collection date, and we’d encourage news media and public to follow these numbers, if not already. They provide a more accurate view of how fast the epidemic is spreading. 12/ tn.gov/health/cedep/n…
In sum, we have a #COVID19 spike that continues to stress TN hospitals. We have also seen TN at the top of national rankings, in part due to the state working through a backlog of test results, which ⬆️ the number of reported cases. 13/
When the backlog is cleared and numbers *appear to* drop, we will still have a *serious* hospital crisis.

#WearAMask
#WatchYourDistance
#WashYourHands
#AvoidCrowds X/

• • •

Missing some Tweet in this thread? You can try to force a refresh
 

Keep Current with Vanderbilt Dept. of Health Policy

Vanderbilt Dept. of Health Policy Profile picture

Stay in touch and get notified when new unrolls are available from this author!

Read all threads

This Thread may be Removed Anytime!

PDF

Twitter may remove this content at anytime! Save it as PDF for later use!

Try unrolling a thread yourself!

how to unroll video
  1. Follow @ThreadReaderApp to mention us!

  2. From a Twitter thread mention us with a keyword "unroll"
@threadreaderapp unroll

Practice here first or read more on our help page!

More from @VUHealthPol

2 Oct
NEW: Nashville news media have seen and reported rising #coronavirus hospitalizations in the past week, a trend we have also observed... 1/
However, what we have also seen is a shift in the age distribution of new #COVID19 cases in #Tennessee regions recently into older age groups, which we know to be at higher risk of poor outcomes, like hospitalization and death. 2/
So what does this mean? This is a trend to watch closely. New cases happen before hospitalizations, which could mean we might see increasing stress on the state’s health care system. 3/
Read 6 tweets
14 Aug
NEW in @JAMANetworkOpen from @stephenwpatrick, @MelindaBBuntin @ashleyleech et al...

Pregnant women have a harder time getting treatment for #opioid use disorder than nonpregnant women.

MORE ➡️ vumc.org/health-policy/… Image
“Only about half of women were given an appointment for treatment with their insurance, the rest were either told no or had to pay cash. In some states, only about 1-in-5 women were given appointments with their insurance,” @stephenwpatrick said. Image
Image
Read 4 tweets
9 Jul
NEW: Hospitalizations for #COVID__19 continue to rise across #Tennessee, and age demographics for those patients is changing. Learn more in our newest report on the epidemic in Tennessee. ➡️ vumc.org/health-policy/… Image
Here is a "heat map" of median age by region over time. It's a very different situation depending where you are in Tennessee. Age is a leading risk factor, per the @CDCgov Image
Overall, #Covid hospitalizations are on a steep incline in different parts of the state as well. Read the full report here ➡️vumc.org/health-policy/… Image
Read 4 tweets
6 Jul
NEW: Here's an updated look at Tennessee's #COVID19 transmission number (R0), and where the most cases are over the last 10 days. (Data current as of July 6.)

Find this and more resources on the public health response to the pandemic here ➡️ vumc.org/health-policy/… Image
As a reminder, an R0 above 1.0 means the virus is spreading and gaining momentum, and people who are infected are infecting more than 1 other person on average.
Here's a closer look at the area around #Memphis. (Note: Gray boundaries are counties, shaded areas are ZIP codes) Image
Read 11 tweets
29 Jun
NEW: Here's an updated look at Tennessee's #COVID19 transmission number (R0), and where the most cases are over the last 10 days, from our #COVIDmodel. (Data current as of June 29.)

Also, w/ hospital coalition regions for a closer look at areas w/ higher reported numbers. Image
Here's a closer look at the area around #Memphis over the last 10 days. (Note: Gray boundaries are counties, shaded areas are ZIP codes) Image
Here's a closer look at the area around #Knoxville and #Gatlinburg over the last 10 days. (Note: Gray boundaries are counties, shaded areas are ZIP codes) Image
Read 9 tweets
22 Jun
NEW: Here's an updated look at Tennessee's #COVID19 transmission number (R0), and where the most cases are over the last 10 days, from our #COVIDmodel. (Data current as of June 22.)

Also w/ hospital coalition regions for a closer look at areas w/ higher reported numbers. Image
Here's a closer look at #Chattanooga area over the last 10 days. (Note: Gray boundaries are counties, shaded areas are ZIP codes) Image
Here's a closer look at #Knoxville and #Gatlinburg area over the last 10 days. (Note: Gray boundaries are counties, shaded areas are ZIP codes) Image
Read 8 tweets

Did Thread Reader help you today?

Support us! We are indie developers!


This site is made by just two indie developers on a laptop doing marketing, support and development! Read more about the story.

Become a Premium Member ($3/month or $30/year) and get exclusive features!

Become Premium

Too expensive? Make a small donation by buying us coffee ($5) or help with server cost ($10)

Donate via Paypal Become our Patreon

Thank you for your support!

Follow Us on Twitter!