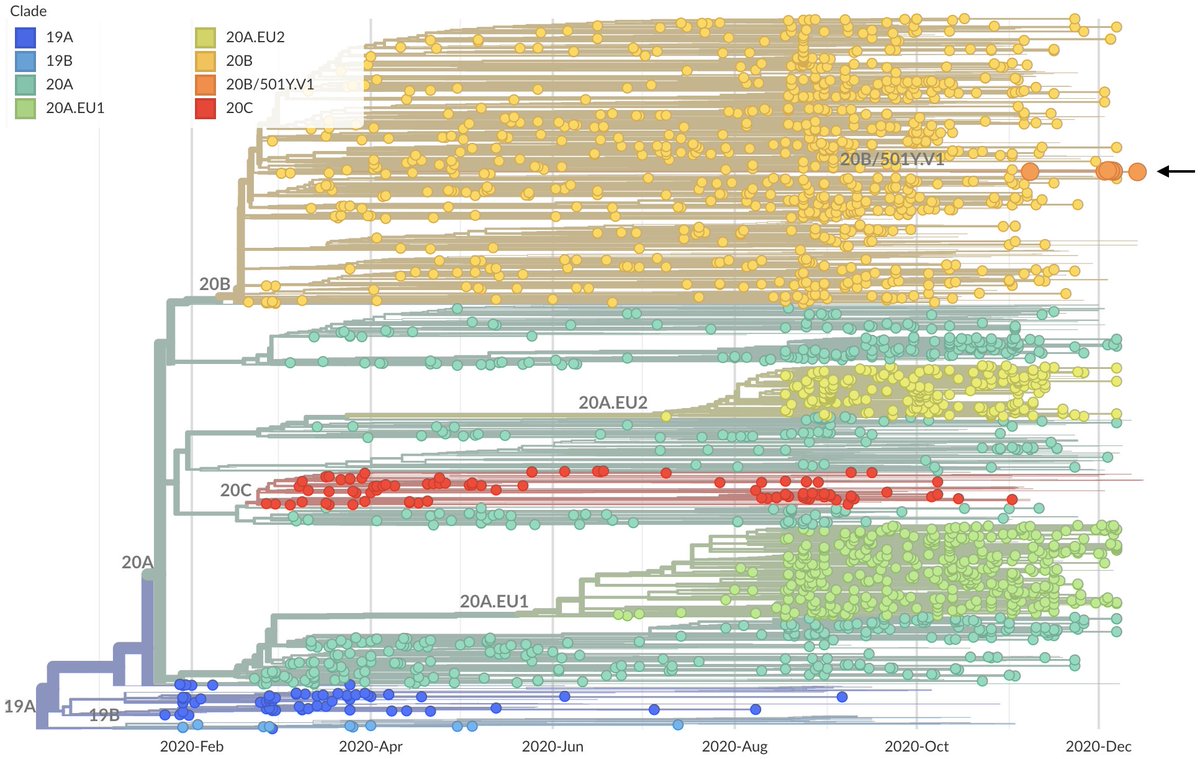
With data that has emerged in the last week, I'm now 80-90% convinced that infections by the UK variant virus (Pangolin lineage B.1.1.7, @nextstrain clade 20B/501Y.V1) result in, on average, more onward infections, ie are more transmissible. 1/10
My thinking primarily comes from three data points: 1. rapid increase in frequency of variant over wildtype 2. higher secondary attack rate of variant than wildtype 3. increased viral loads of variant over wildtype as measured by Ct
2/10
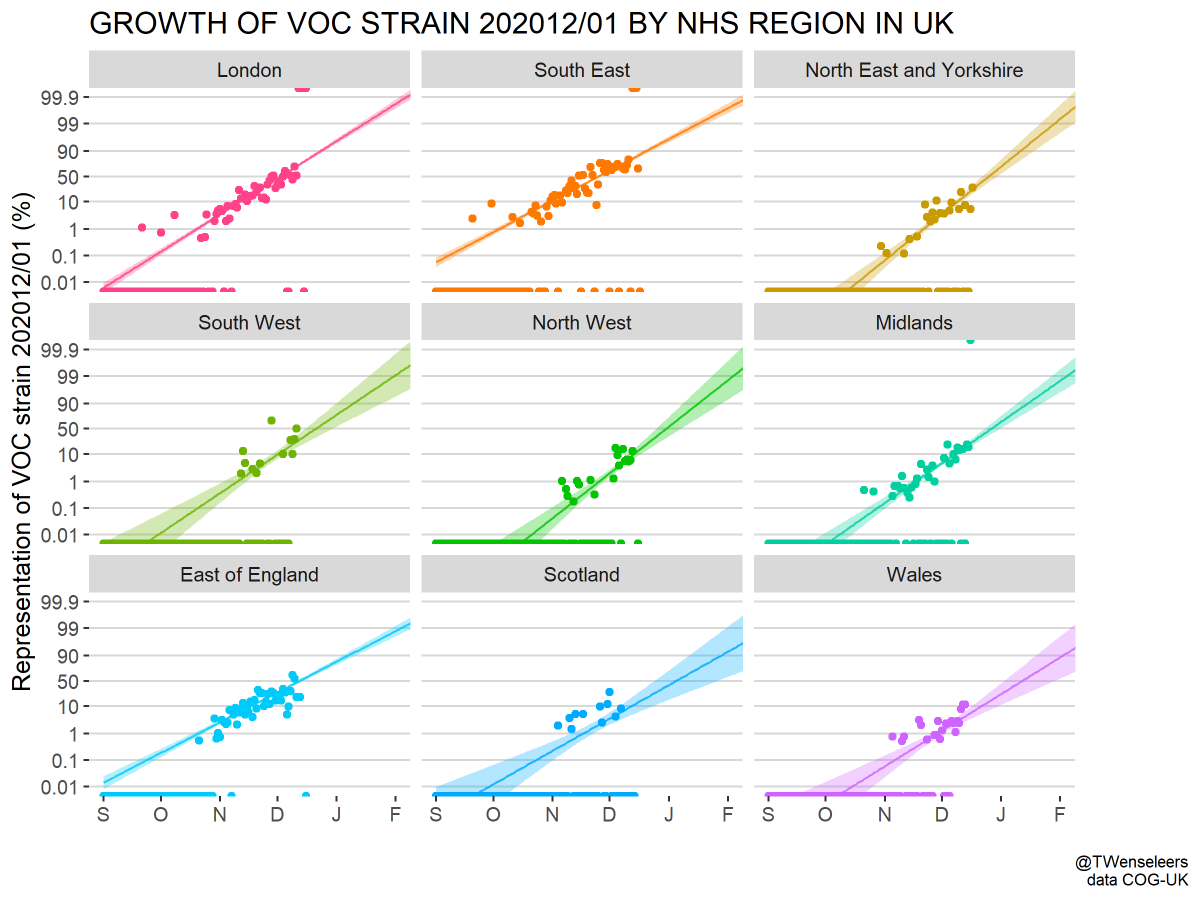
For point 1 (increase in frequency) we have pretty much the same data as of a week ago, where we see increasing frequency of variant over wildtype across the UK. This can be readily seen in this analysis by @TWenseleers. 3/10
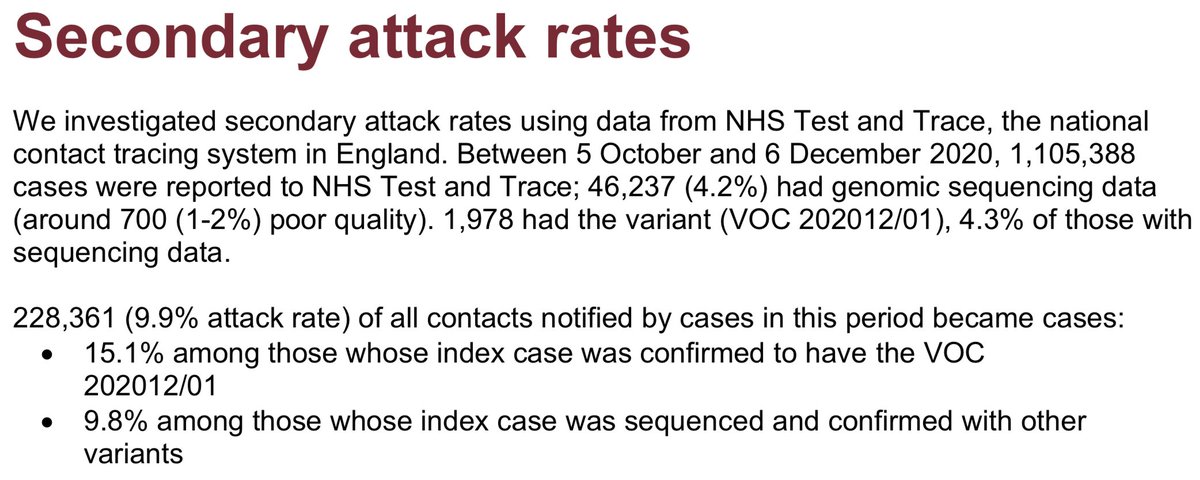
For point 2 (secondary attack rate), we have new data from the second @PHE_uk technical report (gov.uk/government/pub…) where a matched cohort study was conducting comparing 1769 wildtype cases and 1769 matched variant cases. 4/10
By integrating contact tracing data @PHE_uk was able to compare secondary attack rate between wildtype cases and variant cases, where ~10% of contacts of wildtype cases go on to be detected as COVID+ compared to ~15% of contacts of variant cases. 5/10
Both increase in frequency and secondary attack rate indicate essentially the same quantity, which is the number of secondary infections left by a primary infection, ie R, and tells us that realized transmission rate is likely higher in variant than wildtype infections. 6/10
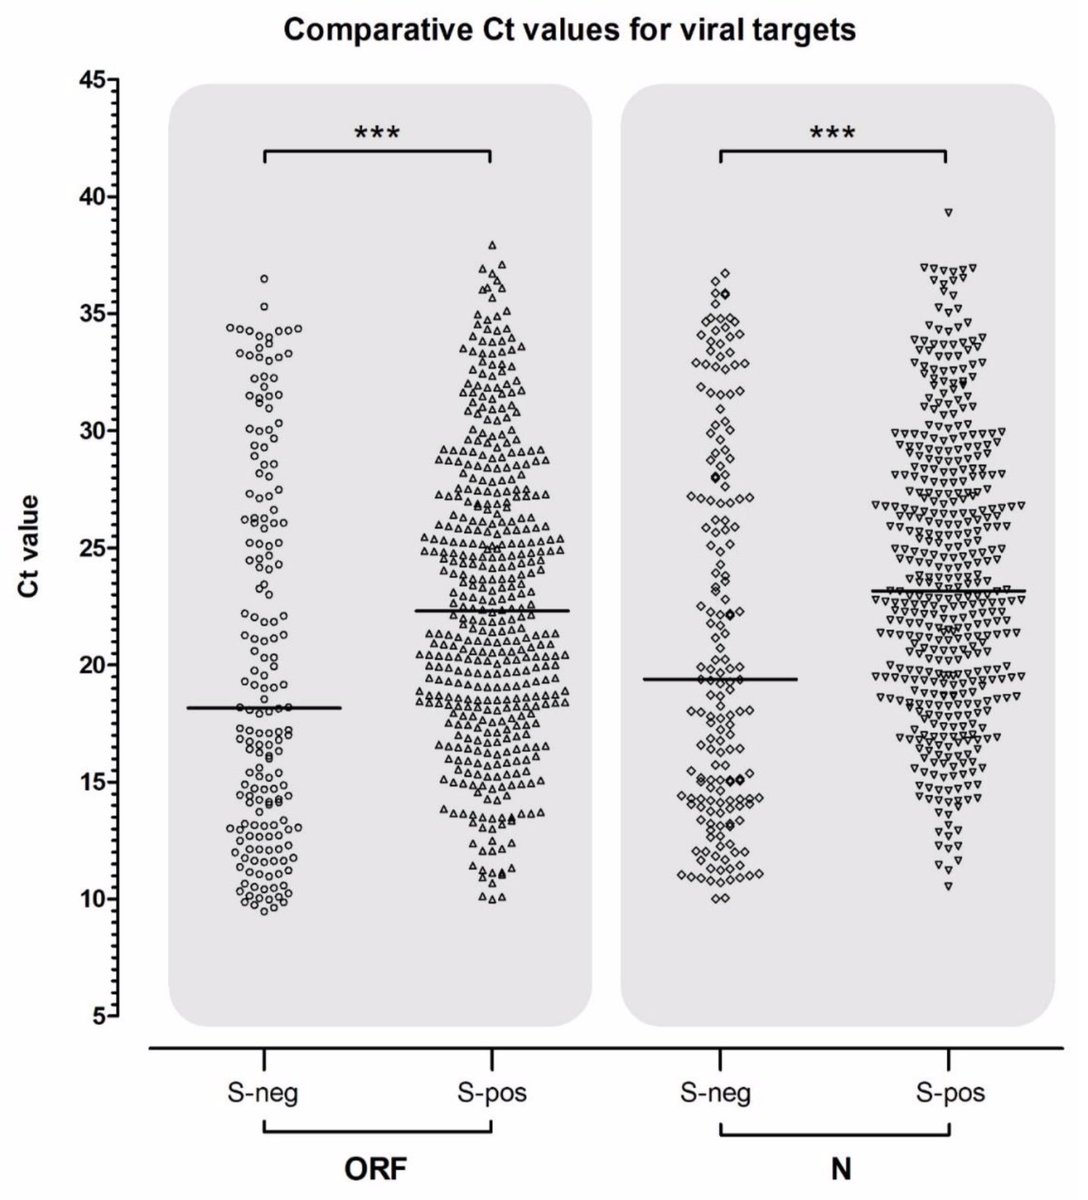
For point 3 (viral load), we have new data as reported by Michael Kidd, @alanmcn1 et al (medrxiv.org/content/10.110…) that shows that variant cases (as identified by S dropout) have Ct values ~4 units lower than wildtype cases. 7/10
This translates to an estimated 10 to 100-fold increase in average viral load of variant cases. This gives a hypothesized mechanism for increased transmissibility, ie individuals infected by the variant will on average expel more virus and be consequently more infectious. 8/10
The @PHE_uk matched cohort study shows early evidence for a lack of severity difference in terms of hospitalizations and deaths between wildtype cases and variant cases. And additionally shows lack of detectable differences in re-infection rate between variant and wildtype. 9/10
Scientists in the UK are working intensely to address questions of transmissibility, severity and antigenicity of the variant virus and we should learn more in the coming days and weeks, and especially as we see how the UK epidemic continues to play out. 10/10
Follow up #1: The @PHE_uk secondary attack rate analysis was not done on the matched cohort. There should be more stratification here. I'm sorry for the confusion. I'd take the 15% vs 10% secondary attack rate with a grain of salt for the moment.
Given that the US has not detected SARS-CoV-2 variant viruses 501Y.V1 or 501Y.V2, what bounds can we place on their current frequency in the US based on sample counts? 1/12
However, because the US is generally slower at turnaround of specimens into SARS-CoV-2 sequences than the UK, we lack confidence that 501Y.V variants are absent from the US. 3/12
Given the large discrepancy in specimens collected in Dec that were sequenced and shared between the US and the UK, I wanted to follow up on the relative quality of genomic surveillance in the US and the UK. 1/12
First thing to clarify, in the @nytopinion opinion piece yesterday (nytimes.com/2020/12/22/opi…), it's mentioned that "since Dec. 1, Britain has sequenced more than 3,700 coronavirus cases, compared with fewer than 40 cases in the United States, according to Trevor Bedford". 2/12
As of today, the UK has shared to @GISAID 23,377 genomes during Dec and the US has shared 8033 genomes. However, the UK turnaround time has been much faster with 5010 specimens that were collected in Dec shared vs 65 collected in Dec and shared by the US. 3/12
Following up on general thoughts on antigenic drift of #COVID19 from this weekend, I wanted to discuss what we know about the new variant of SARS-CoV-2 thats emerged in the UK. 1/17
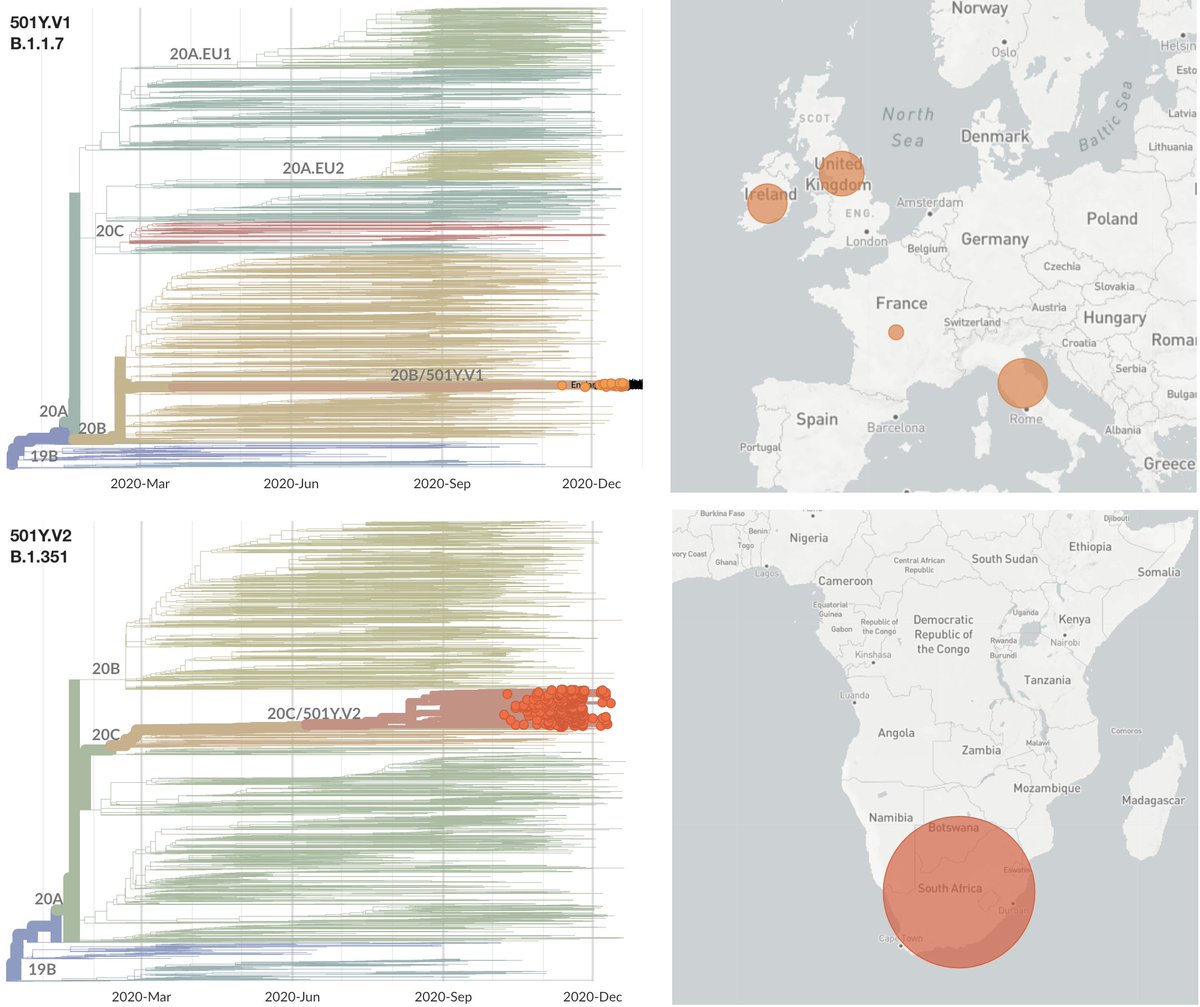
This variant is referred to as the B.1.1.7 lineage in cov-lineages.org nomenclature and clade 20B/501Y.V1 in @nextstrain nomenclature and can be seen here within circulating viral diversity, where the variant lineage is highlighted in orange (nextstrain.org/ncov/europe?c=…). 2/17
Broadly, I'd characterize the source of concern as arising from the combination of: 1. Multiple mutations that from sequence composition alone are suggestive of biological importance 2. Observed rapid epidemic spread
3/17
With #COVID19 vaccine efficacy of ~95%, I'm looking forward to vaccine distribution in 2021 bringing the pandemic under control. However, I'm concerned that we'll see antigenic drift of SARS-CoV-2 and may need to update the strain used in the vaccine with some regularity. 1/18
First, some background. RNA viruses all evolve extremely rapidly, but some like influenza are able to accept mutations to their surface proteins in such a way that they can partially escape human immunity. This process is known as "antigenic drift". 2/18
For influenza, this necessitates regular vaccine updates to keep up with an evolving virus population. Other RNA viruses like measles mutate quickly but are unable to change protein structure to escape from immunity and so these vaccines don't need updating. 3/18
There has been a significant question about the degree to which Thanksgiving holiday and associated travel and social gatherings may have contributed to transmission of #COVID19. Here I try to briefly address this question. 1/8
Based on known incubation periods (nejm.org/doi/full/10.10…), we expect, on one end, some infections arising on Nov 26 to become symptomatic on Nov 30 and on the other end, for some infections arising on Nov 30 to become symptomatic on Dec 6. 2/8
This brackets the window where we expect most of the increased case load to be. However, most states only list cases based on date of report rather than date the case became symptomatic. This causes jitter that's hard to deal with when looking for a Thanksgiving effect. 3/8
Although the US is continuing to hit records for daily #COVID19 cases reported, the rate of exponential growth has slowed. Mortality is still catching up to increased case loads and I expect daily deaths reported to further increase. 1/8
This plot summarizes the overall picture. Bubble size is proportional to daily cases per capita from @COVID19Tracking and bubble color shows Rt from rt.live. Timepoints are shown up to two weeks ago due to delay in reliable estimates of Rt. 2/8
The Midwest and Mountain West had rapid growth during October resulting in large epidemics in November, but they're now starting to plateau or decline in incidence. Although current incidence is lower, the epidemic is still growing in much of the East Coast. 3/8