Latest @PHE_uk COVID surveillance rpt out, covers 28th Dec to 3rd Jan, will start to capture Christmas mixing.

It's devastating reading. Please do everything you can to comply with lockdown, and ask friends/family/your local gov if you need help.

gov.uk/government/sta…
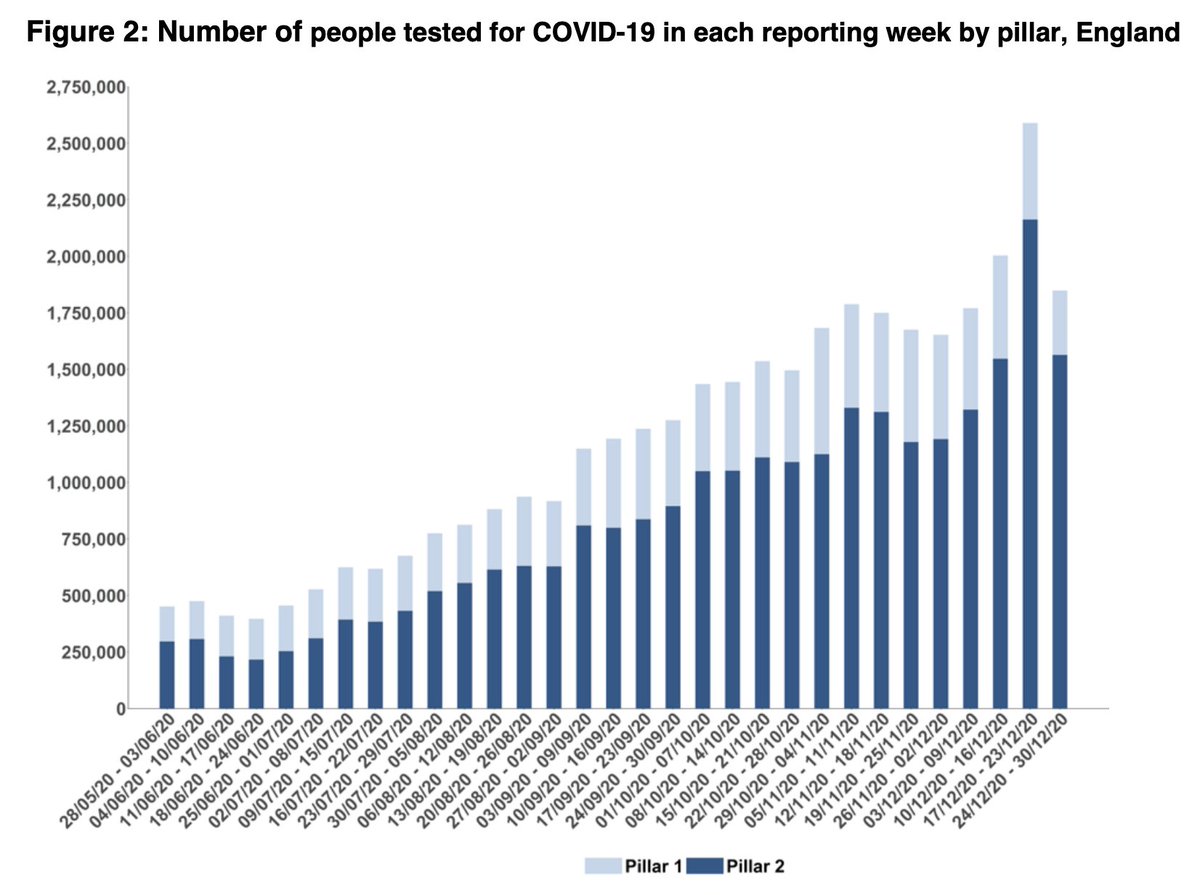
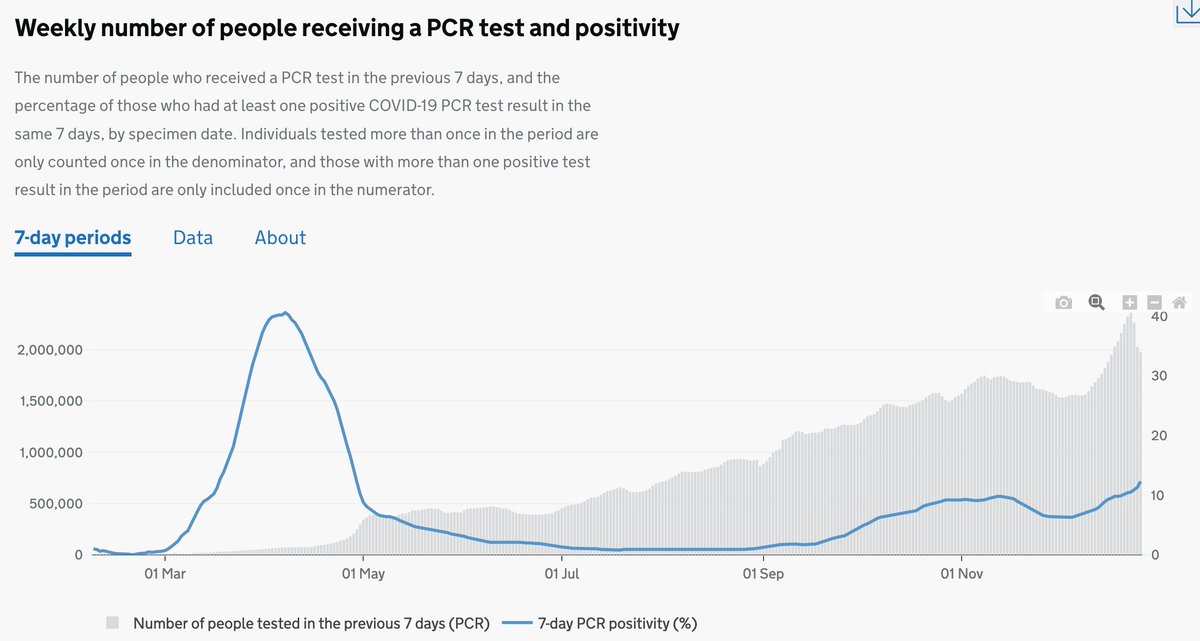
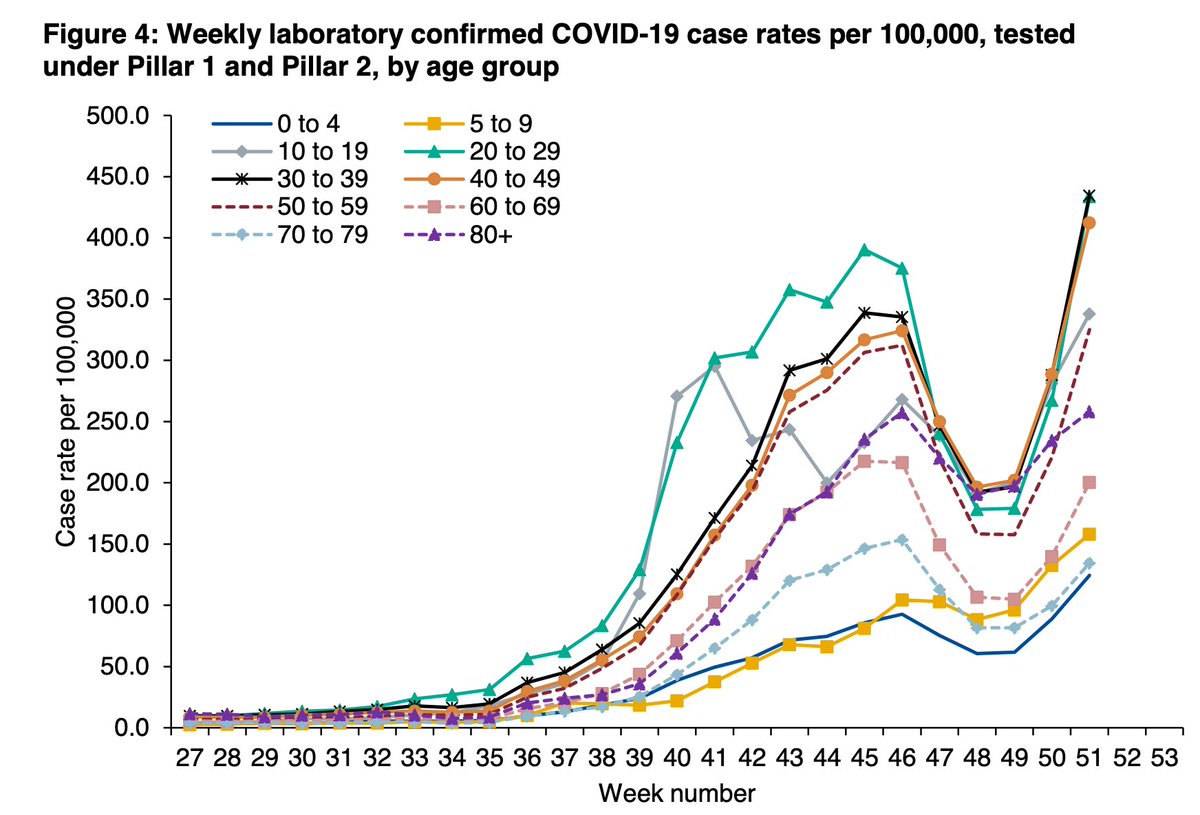
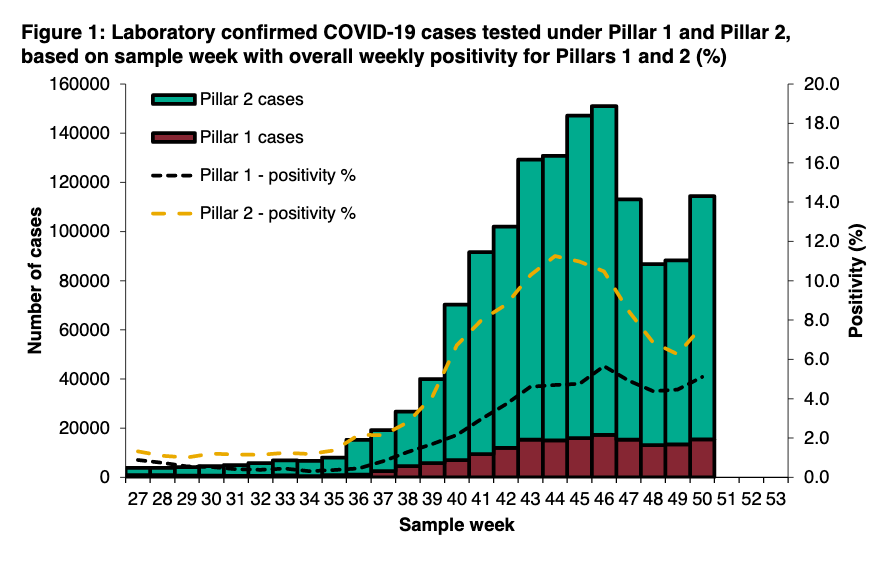
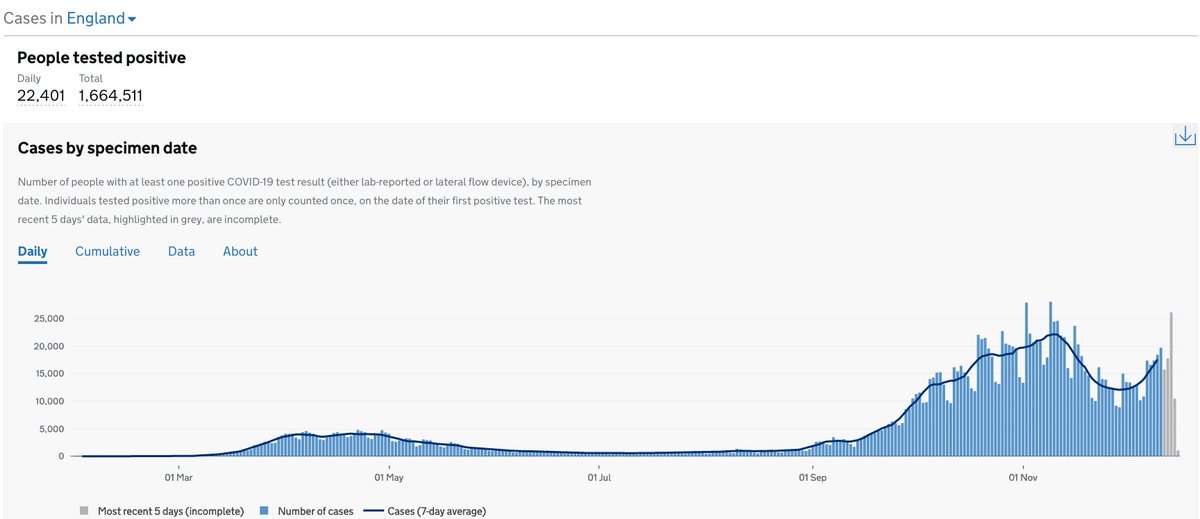
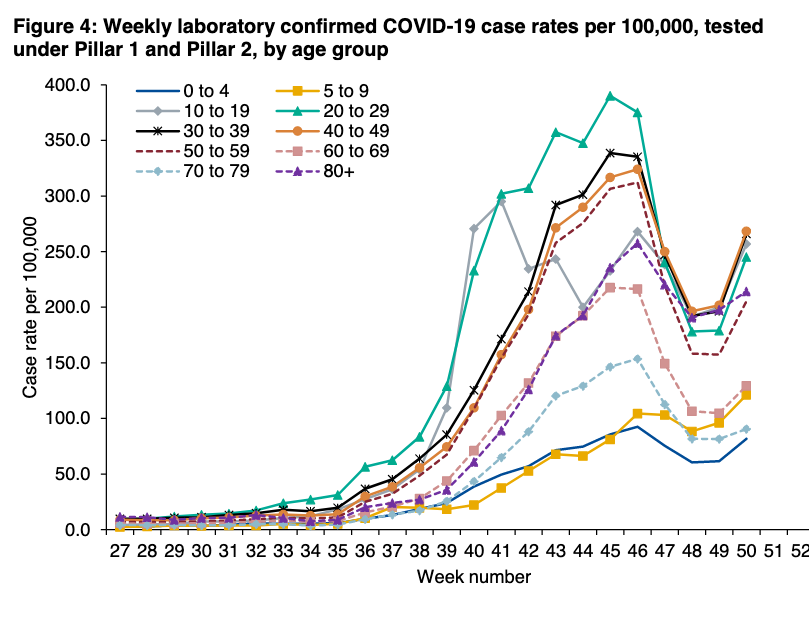
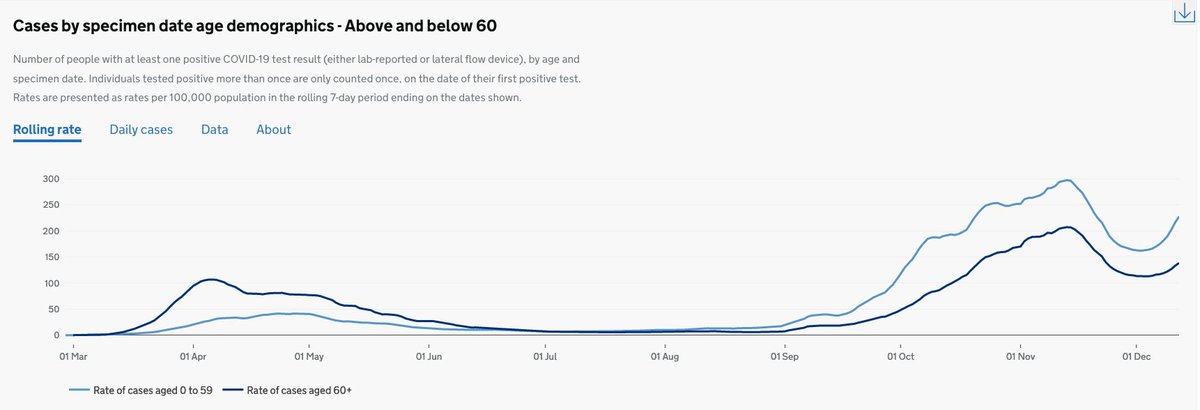
Case numbers and PCR positivity rising steeply. Across all ages and importantly >18yrs more so than <18yr - note step change in >80yrs.
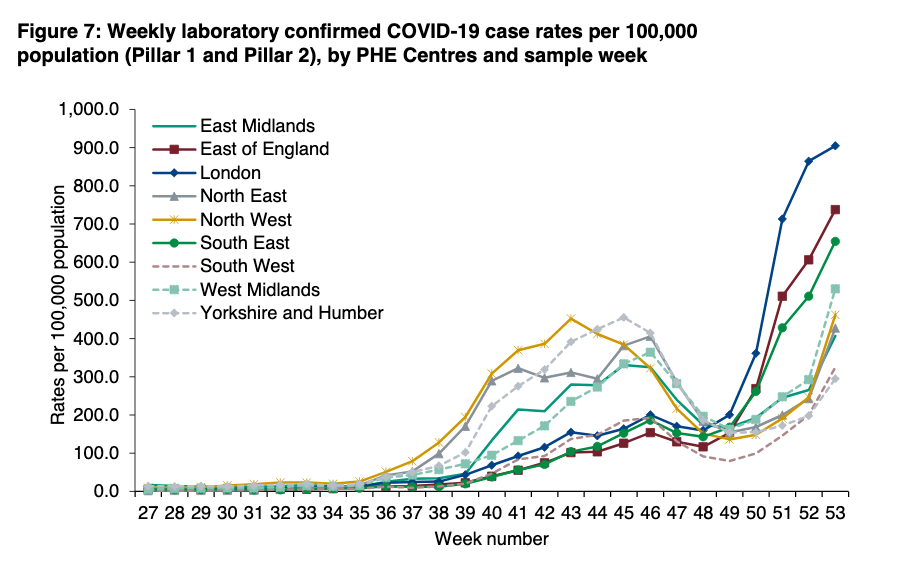
This is also no longer and issue confined to London and the SE (and some potential v early promise the that London peak may be coming soon).
The map by local authority is no longer particularly helpful.
With the rise in case rates in older adults, the rise in reported care home incidents is really concerning.

The NHS is (rightly) all over the news but care homes cannot be neglected again.
Thankfully the same rise in incidents in hospitals is not being seen.
It's here that things are so concerning. The number of admissions never dropped far enough after the Nov peak.

And with admissions lagging 1-2 weeks after cases, we're still a long way from this getting any better.
London is being most heavily impacted, but admissions are following case rates and rising everywhere.
As @HSJEditor reported yesterday, London could be entirely overwhelmed within a fortnight and the SW now has the highest increases in admission rates.

hsj.co.uk/acute-care/exc…

hsj.co.uk/coronavirus/up…
And ITU is equally dramatic. Lagging a week or so behind hospital admissions, with the Midlands expected to be full within two weeks

hsj.co.uk/coronavirus/ex…
This has implications for ALL of us.

Routine and elective care doesn't happen.

Urgent care delayed.

And the potential to be unable to access emergency care for ANY reason.
And deaths inevitably rise with a 2-4 wk lag from diagnosis. With the UK reaching the grim milestone of over 1,000 COVID-related deaths (28 day definition) reported yesterday.

Irrespective of what happens to cases today, we will continue to see rises in deaths for 2-4 wks.
The ONS has reported 2020 deaths are 14% higher than expected based on a 5 yr average - that's 74,000 excess deaths.

2021 is off to an awful start. Please help by staying at home where you can, and supporting those who can't or are struggling.

There is light after all this. The COVID vaccine roll-out has started, there's almost no flu, flu vaccination rates are at record high, and the shortest day of the year is now behind us.

• • •

Missing some Tweet in this thread? You can try to force a refresh
 

Keep Current with Adam Briggs

Adam Briggs Profile picture

Stay in touch and get notified when new unrolls are available from this author!

Read all threads

This Thread may be Removed Anytime!

PDF

Twitter may remove this content at anytime! Save it as PDF for later use!

Try unrolling a thread yourself!

how to unroll video
  1. Follow @ThreadReaderApp to mention us!

  2. From a Twitter thread mention us with a keyword "unroll"
@threadreaderapp unroll

Practice here first or read more on our help page!

More from @ADMBriggs

7 Jan
This week's test and trace data covering 24th to 30th Dec.

Case numbers and contacts rising steeply, and whilst contact tracing remains relatively consistent, some signs that the testing system may be under strain. 🧵

gov.uk/government/pub… ImageImageImageImage
We know cases and positivity rates are going up. Today's PHE surveillance report (to 3rd Jan) puts the numbers into perspective, including the current unprecedented challenge facing acute services.

And as case numbers rose by 24% in most recent wk, the number of people getting tested fell by 30%.

Am not discussing detail of rapid lateral flow devices vs PCR tests here as not confident in the data, but PHE report PCR positivity now at over 16% for community testng (P2) ImageImageImage
Read 18 tweets
1 Jan
Most recent Test and Trace data for 17th - 23rd Dec.

Worrying fall in test performance, contact tracing remains v strong. Apologies for the fairly long NY thread 🧵

(still no T&T graphs this week)

gov.uk/government/pub…
A huge 2.4m people were tested - up 20% on the week before. And 232k people tested positive, 33% more than last week and more than double two weeks before.

Positivity up to 9.7% from 8.8% wk before (7.9% in pillar 1, 10% in pillar 2).

Figure is from @PHE_uk, to 27th December
Increasingly hard to interpret P2 test positivity trends (community testing).

Includes the rapid lateral flow devices (LFDs) and PCR tests.

LFDs increasing and now make up 10% of P2 tests (242k) but their positivity is just 1.8% (0.4% 2wks before).

P2 PCR positivity is 10.3%
Read 21 tweets
24 Dec 20
Because it's Christmas eve and there's not much else to do whilst sitting in a dark room waiting for small people to go to bed, here's a quick look at today's T&T data.

Covers 10-16th Dec.

Test times much worse, contact tracing continues to improve.🧵

gov.uk/government/pub…
Any graphs this wk are from PHE report. T&T are just providing data update.

Number of people tested up 12% to 1.99m but positive tests up 58% to 174k, incl a v large 67% increase in pillar 2 (community testing, including use of lateral flow tests in those who are asymptomatic).
Big drop in performance for P2 test turnaround times.
- Regional test sites, 36% of results are provided within 24hrs of taking a test, down from 63% the week before.
- For local test sites the drop is from 51% to 22%
- Mobile test sites: from 68% to 48%
Read 12 tweets
24 Dec 20
PHE's weekly flu and COVID surveillance report now out.

Covering 15th-22nd December.

As PHE's Dr Yvonne Doyle says, this is not a normal Christmas. Please don't treat it like one.

gov.uk/government/sta…
As the gov.uk dashboard has been telling us, cases are now well above the second wave peak and despite increased use of LFDs, positivity is also rising fast.
Cases rising in all age groups, particularly 20-59yrs and now there looks to be relatively steep rises in 60-69yr olds.
Read 17 tweets
17 Dec 20
Test and Trace wk 28 data covering 3/12 to 9/12.

Case numbers up and performance either similar or improving. This is well timed as we head to Christmas.

gov.uk/government/pub…
As is now abundantly clear and has been for some time, case numbers are rising (12% up this week)

(**skip the next five tweets if not interested in the subtleties of pillar 2 testing**)
Number of tests increased this week, as did positivity, but it's getting increasingly hard to disentangle.

In Pillar 2 there were 1,368,539 tests and 1,318,768 individuals tested (so 49,771 tests were people tested >once).

Pillar two tests (community) includes all this:
Read 16 tweets
17 Dec 20
PHE's COVID surveillance report covering 7th - 13th December landed today.

It's difficult reading.

It's just the second week since lockdown ended but case rates, hosp admissions, and now ICU admissions are all rising, with more deaths inevitable. 🧵

gov.uk/government/sta…
As was clear from the gov.uk daily data, case numbers rising, and doing so quite rapidly.
This is in all age groups (with over case rates in those over 60yrs being a predictor of hospital admissions)
Read 16 tweets

Did Thread Reader help you today?

Support us! We are indie developers!


This site is made by just two indie developers on a laptop doing marketing, support and development! Read more about the story.

Become a Premium Member ($3/month or $30/year) and get exclusive features!

Become Premium

Too expensive? Make a small donation by buying us coffee ($5) or help with server cost ($10)

Donate via Paypal Become our Patreon

Thank you for your support!

Follow Us on Twitter!