This week's test and trace data covering 24th to 30th Dec.
Case numbers and contacts rising steeply, and whilst contact tracing remains relatively consistent, some signs that the testing system may be under strain. 🧵
gov.uk/government/pub…
Case numbers and contacts rising steeply, and whilst contact tracing remains relatively consistent, some signs that the testing system may be under strain. 🧵
gov.uk/government/pub…


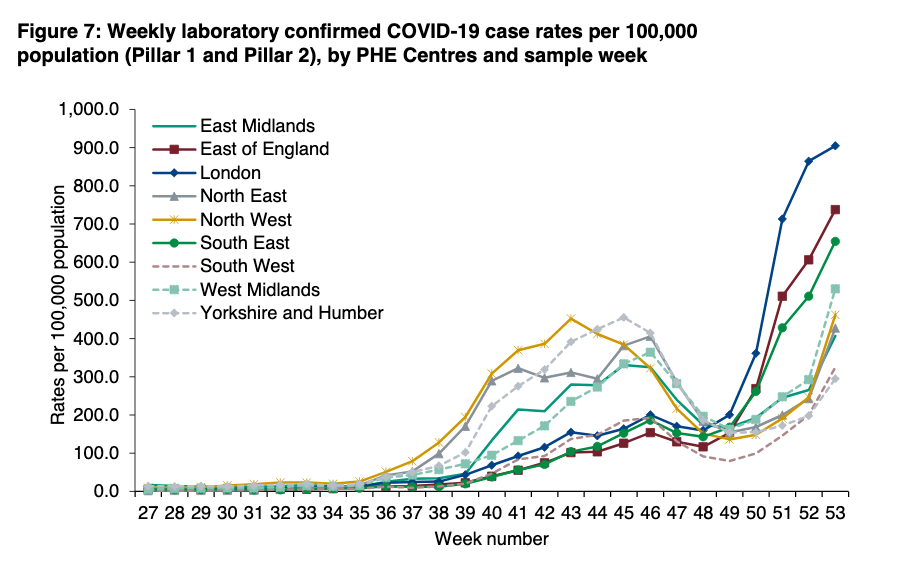
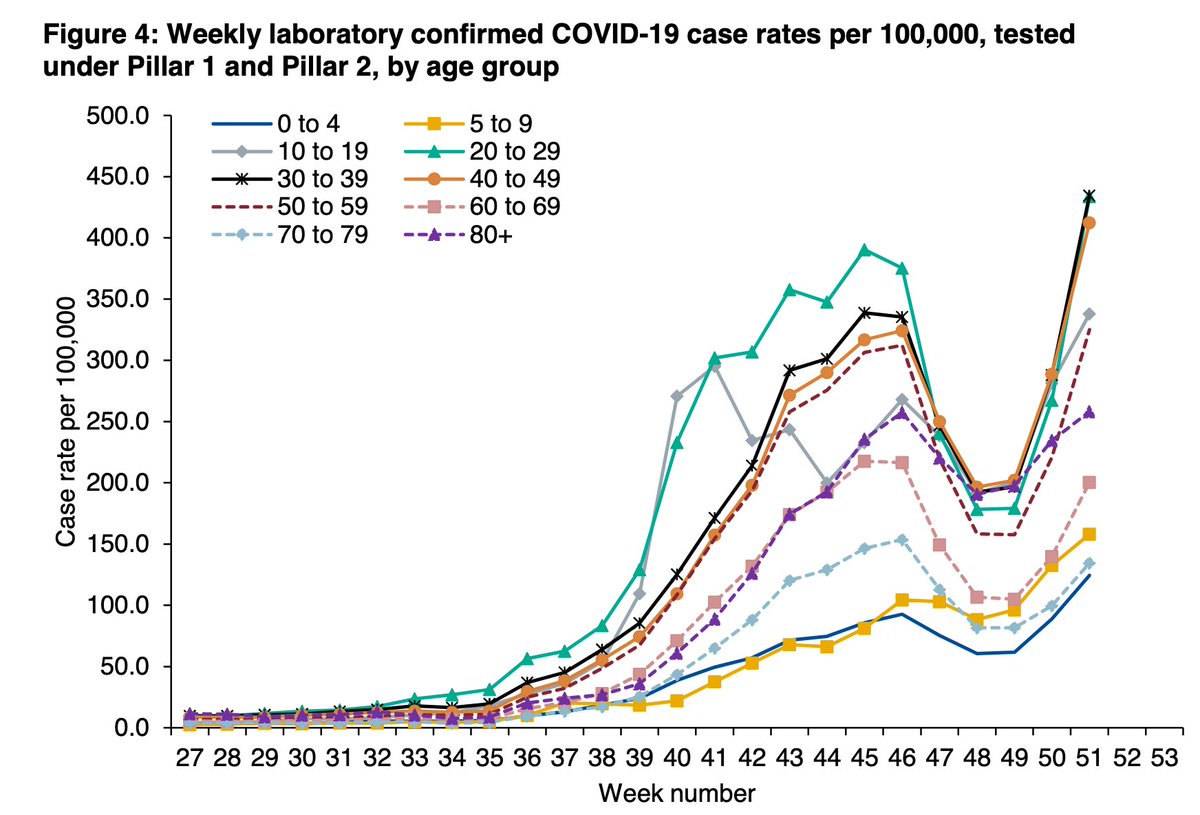
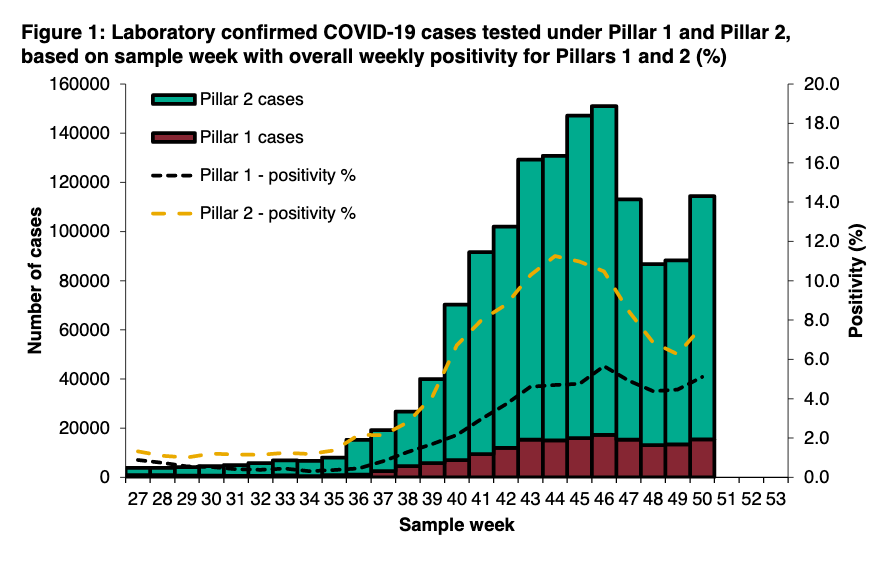
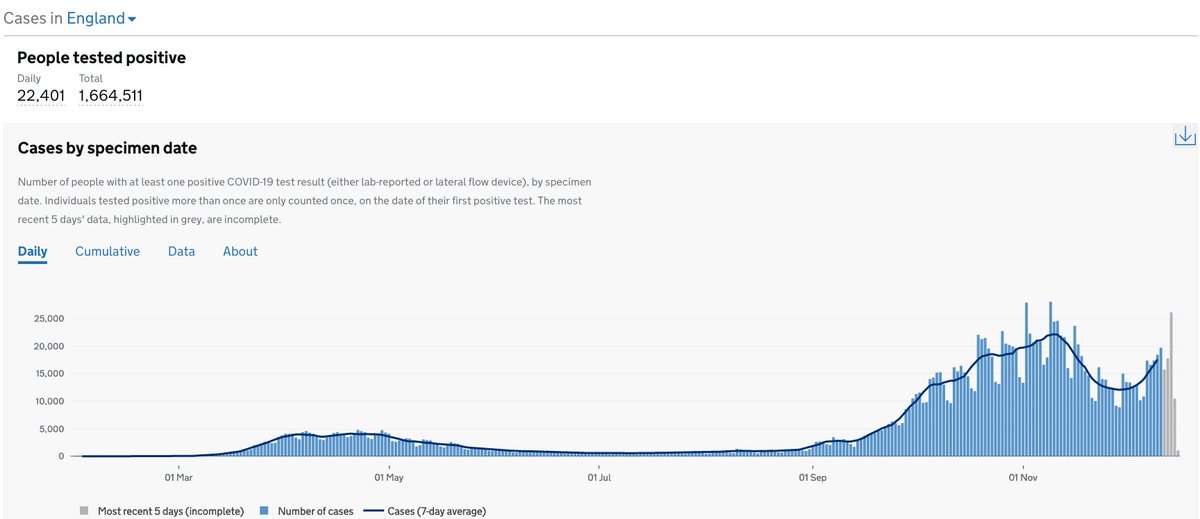
We know cases and positivity rates are going up. Today's PHE surveillance report (to 3rd Jan) puts the numbers into perspective, including the current unprecedented challenge facing acute services.
https://twitter.com/ADMBriggs/status/1347204295318507524?s=20
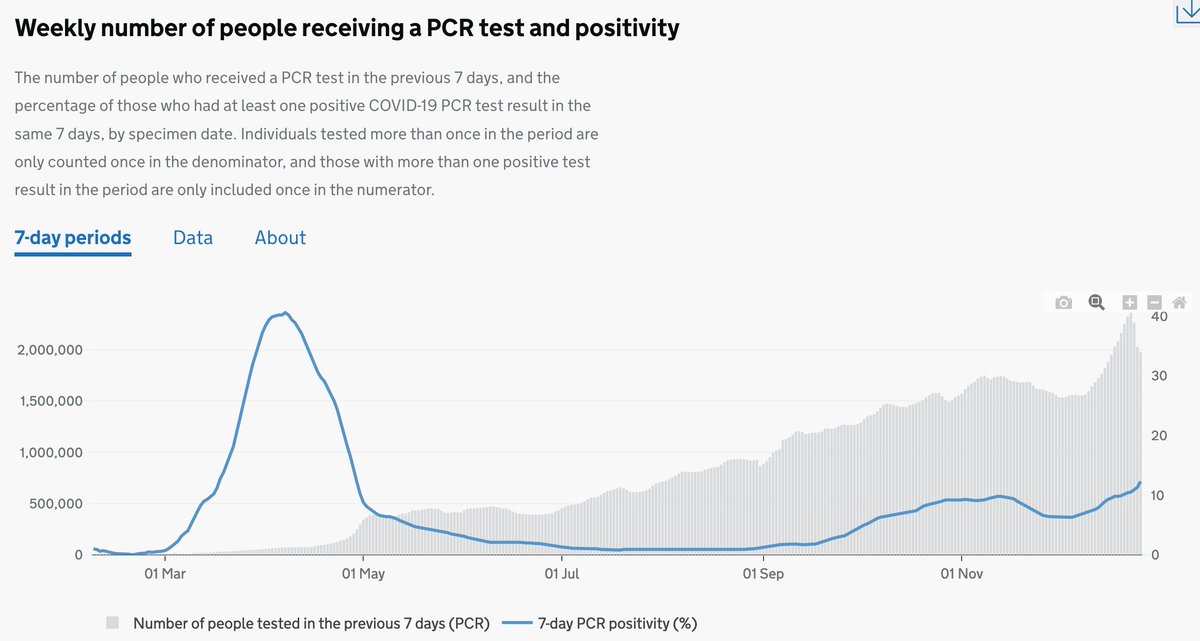
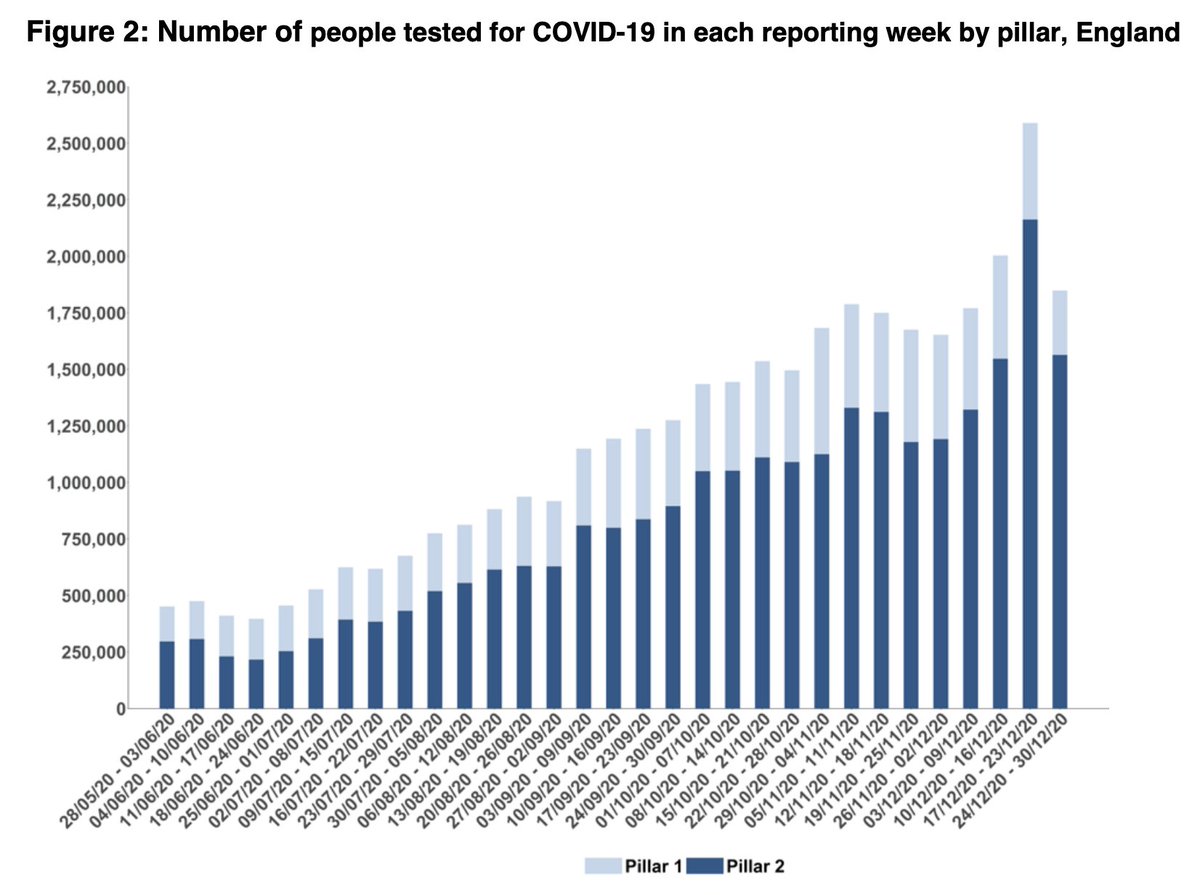
And as case numbers rose by 24% in most recent wk, the number of people getting tested fell by 30%.
Am not discussing detail of rapid lateral flow devices vs PCR tests here as not confident in the data, but PHE report PCR positivity now at over 16% for community testng (P2)
Am not discussing detail of rapid lateral flow devices vs PCR tests here as not confident in the data, but PHE report PCR positivity now at over 16% for community testng (P2)


Test turnaround times really worsened in the two weeks leading up to Christmas as demand grew.
Fewer people were tested in the most recent week over Christmas, and performance has improved slightly, but not yet back to where things were at the start of the month.
Fewer people were tested in the most recent week over Christmas, and performance has improved slightly, but not yet back to where things were at the start of the month.
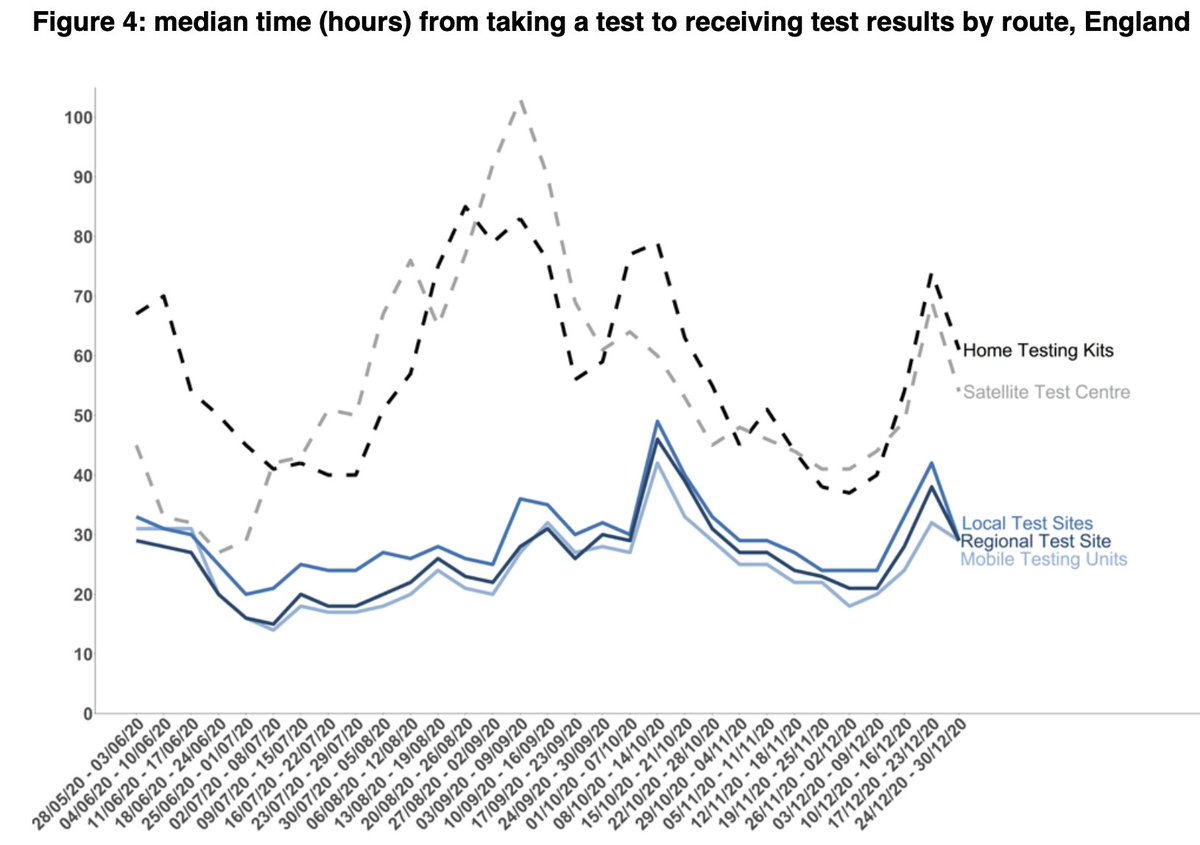

Despite lockdown, this remains a metric to watch. Anything that lengths time to a case being transferred to T&T means it's longer before close contacts are identified and advised to isolate. And more chance for transmission.
Contact tracing performance remains relatively stable despite handling nearly 175k more cases and 300k more contacts than just three weeks previously.

85% of cases were reached and 80% of these gave details of contacts (both in line with previous weeks).

There was a drop in the percentage of cases reached within 24hrs to 73% from 80% the week before.
This has implications not just for speed of reaching contacts, but for local authority contact tracing systems that take cases not reached by the national team within 24hrs.
This has implications not just for speed of reaching contacts, but for local authority contact tracing systems that take cases not reached by the national team within 24hrs.

There will also have been operational changes over Christmas (for example, some local systems agreed with the national team not to take cases on the bank holidays over Christmas) so again will be interested to see which way this goes next week as case numbers rise again.
Just shy of 500,000 contacts were identified, up 20% on last week.
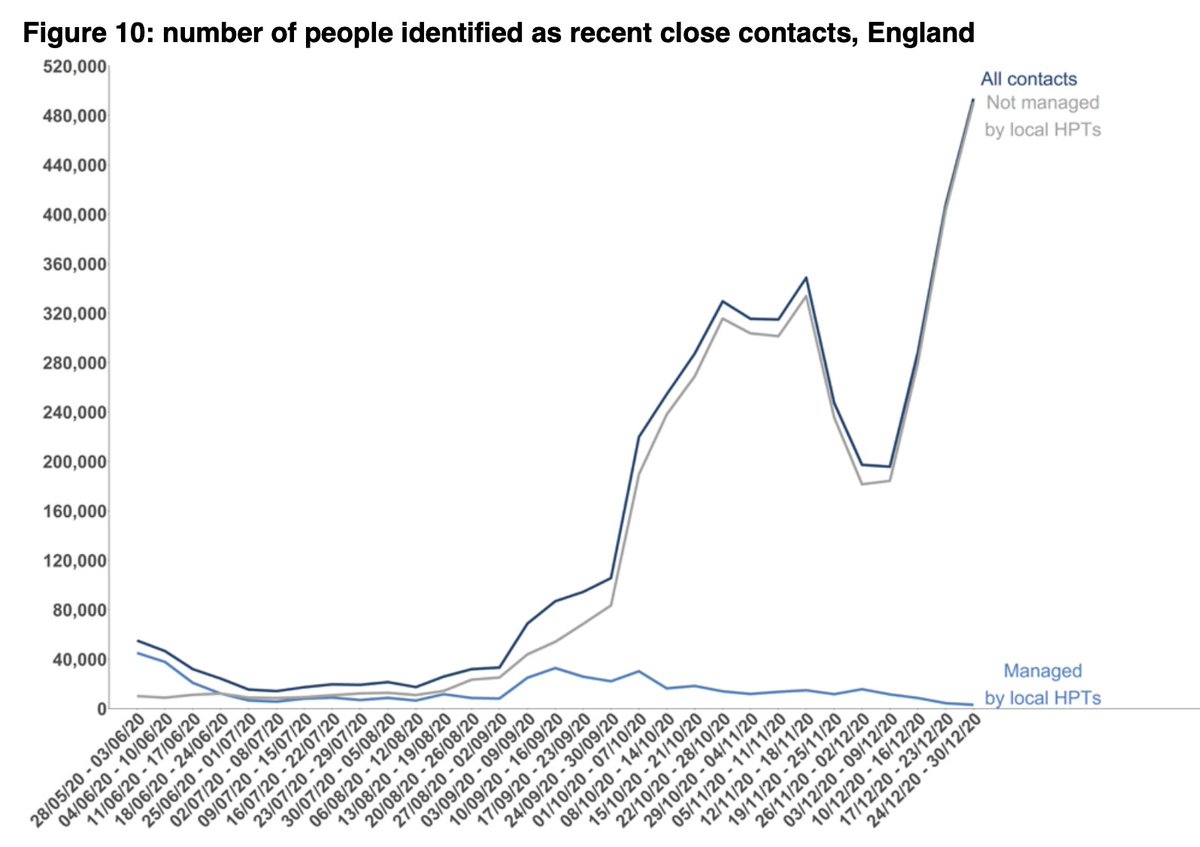
For cases managed by local PHE health protection teams (those in more complex settings/outbreaks), the number of contacts per case has fallen further and is now just 0.6 per case (for cases handled by T&T it's 2.2).
I still don't fully understand this.
I still don't fully understand this.
https://twitter.com/ADMBriggs/status/1345057566871728128?s=20
Despite the huge increase in contacts, the percentage reached remained high at 92%, and these were reached quickly (97% within 24hrs of being identified)


It's good to see T&T doing better in recent wks, although am still nervous about test turnaround times.
TT improvements were too late to do anything about second (and third) wave, but as contact tracing seems to be getting better, attention now needs to focus on ensuring people most in need are given enough social, economic, practical support to isolate when necessary.
Our @HealthFdn T&T tracker is now updated, with @cfraserepi and includes main summary points and some neat images.
health.org.uk/news-and-comme…
health.org.uk/news-and-comme…
Otherwise please take care, don't go out unless necessary, and ask for help if you need it.
Wk 31 T&T ☝️ @felly500 @trishgreenhalgh @deb_cohen @martinmckee @carolecadwalla @mgtmccartney @ADPHUK @Jeanelleuk @fascinatorfun @profchrisham @petermbenglish @HPIAndyCowper @Davewwest @HSJEditor @KateAlvanley @IndependentSage @nedwards_1 @chrischirp @SamanthaJonesUK
@ewanbirney @TimHarford @devisridhar @FurberA @andrewleedr @kieran_walshe @DrChadborn @Dr_D_Robertson
• • •
Missing some Tweet in this thread? You can try to
force a refresh