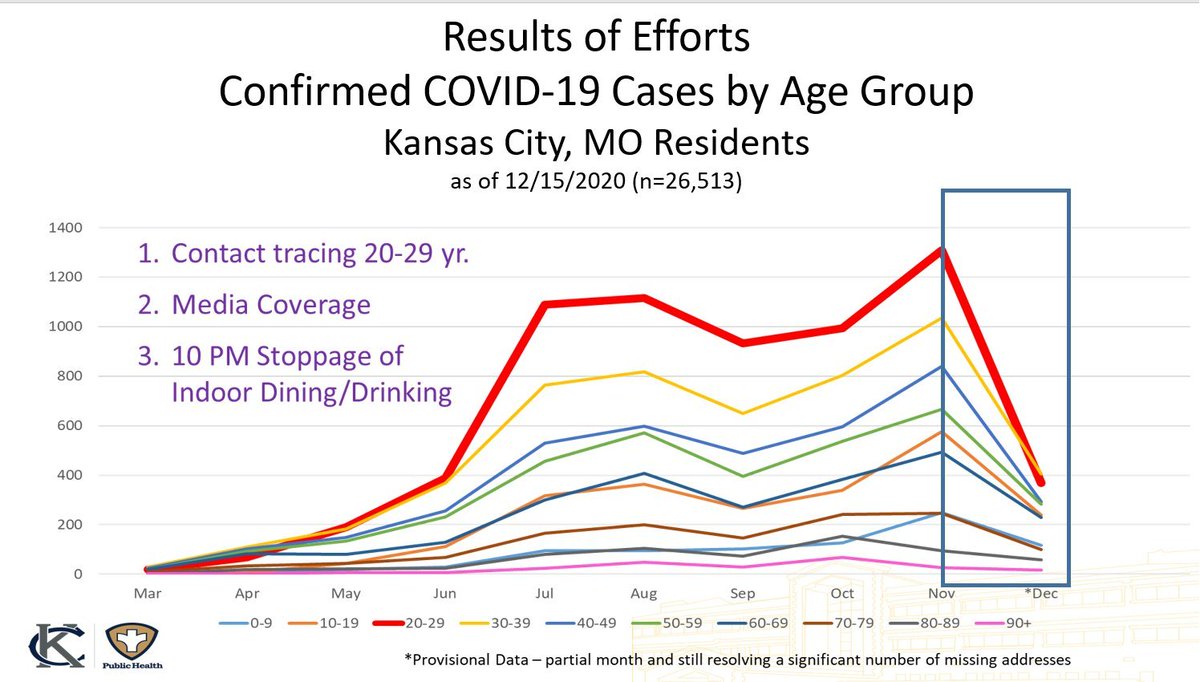
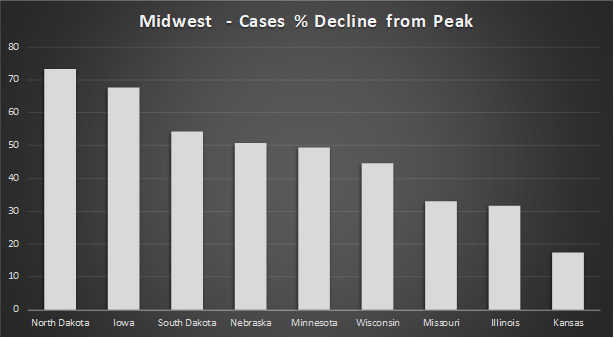
Tired of seeing the same flawed #COVID19 Kansas mask study being shared as proof of "masks working", so I used similar methods + the same dataset and tracked what happened in mandate/non-mandate counties after their study's end date. Pretty different from what the CDC found. Image
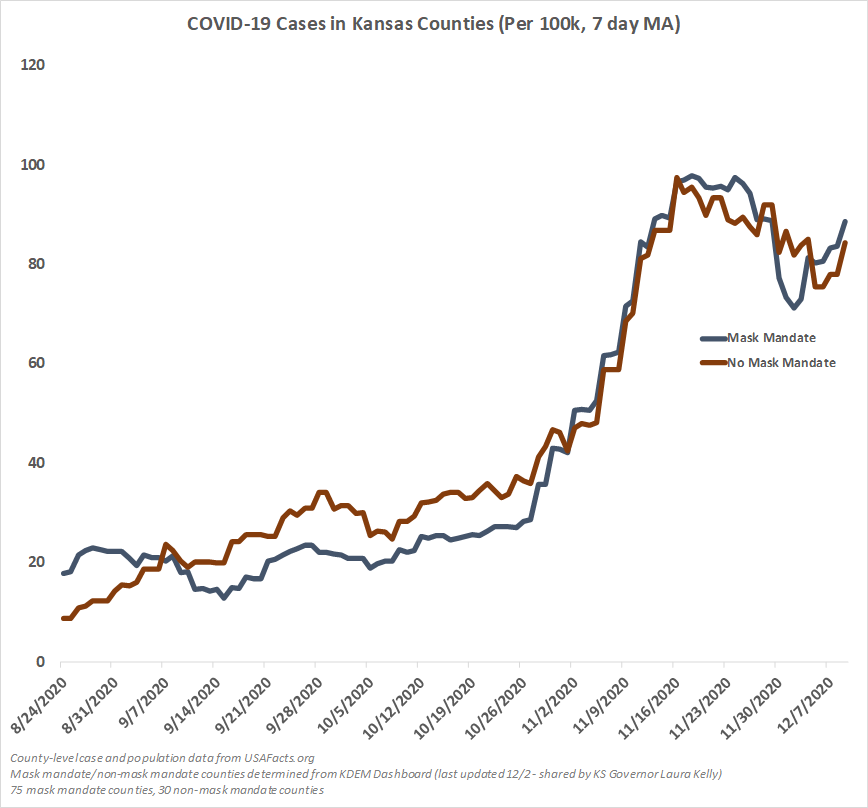
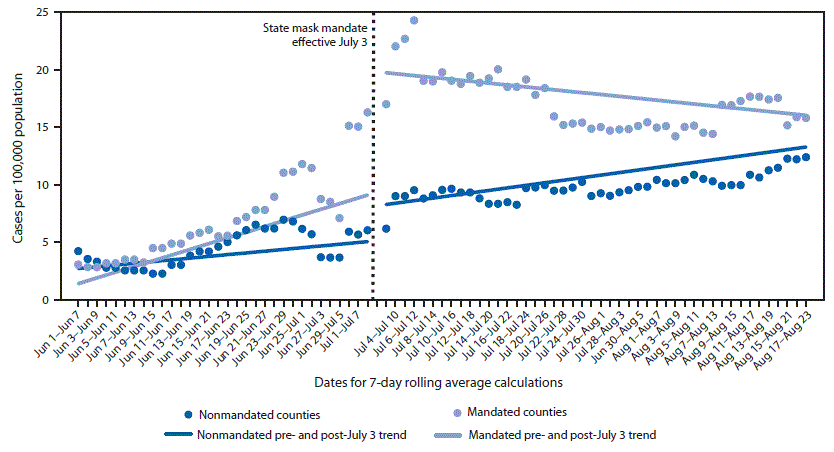
The original observation in the study shared widely by the CDC was that daily cases in mask mandated counties fell while non-mask mandated counties rose. Of course, the conclusion falls apart when you re-run their experiment when SARS-CoV-2 was much more prevalent in Kansas. Image
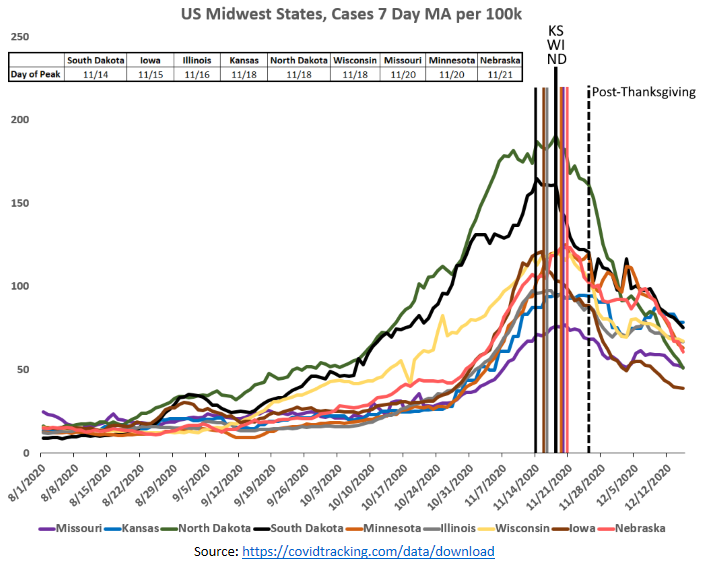
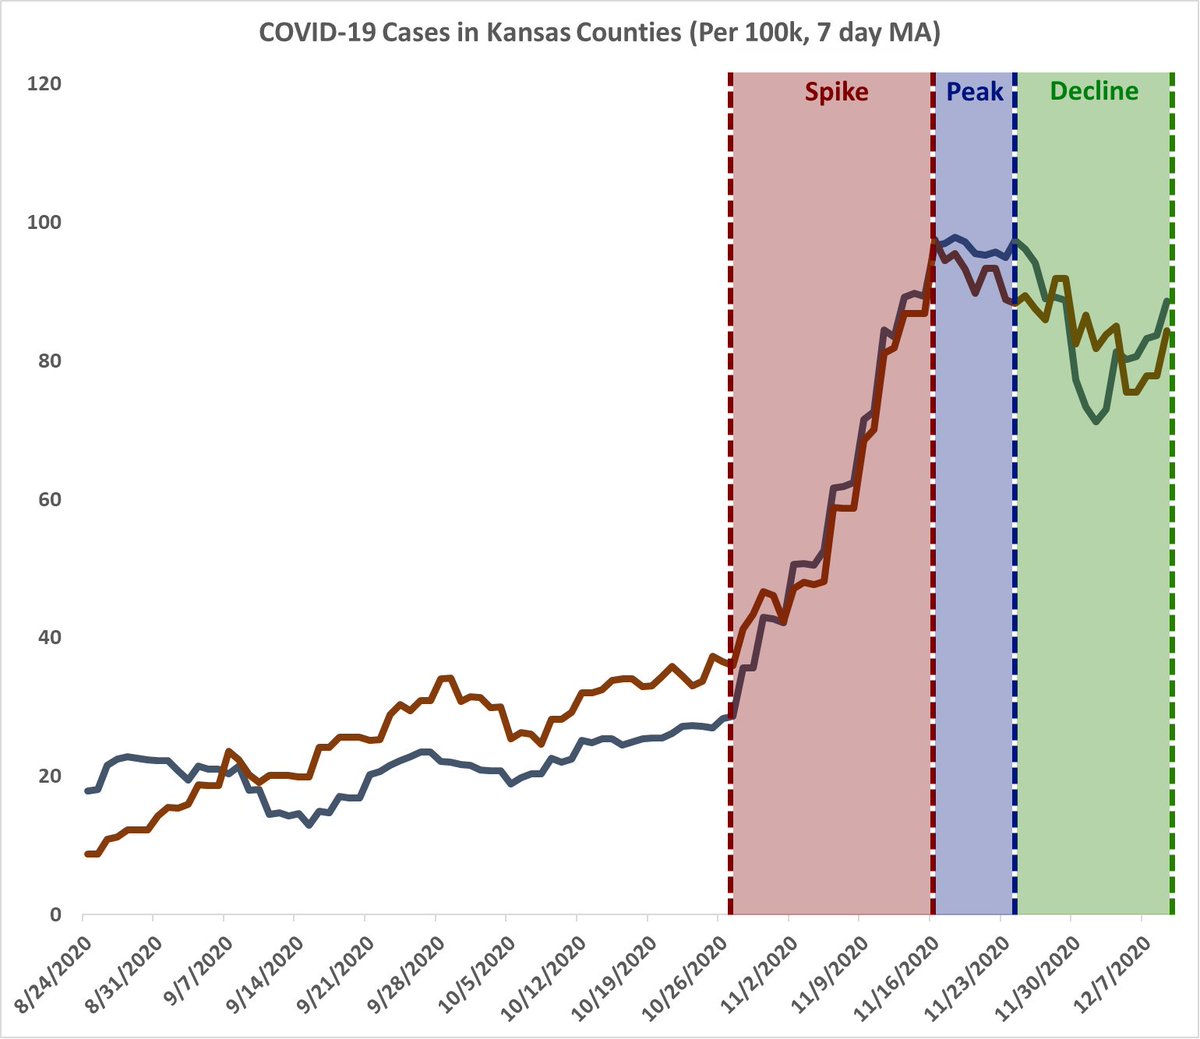
Cases rose, peaked, and fell at the exact same time. Sure, the non-mask mandate counties were higher prior to the peak, but this graph does not account for counties' testing levels, and when case prevalence is so low (basically a baseline) there is a lot of room for noise. Image
Additionaly, there are other concerns with the methodology/reasoning behind the start/end dates in the original CDC study, a few of which @ianmSC outlines here.
Of course, the population is higher in the mask mandate group than the non-mask mandate group - yet when I narrow down the non-mask mandate counties to counties with populations over 20k, you get the same result. Sure, the peak is slightly lower for non-mandate counties, but… Image
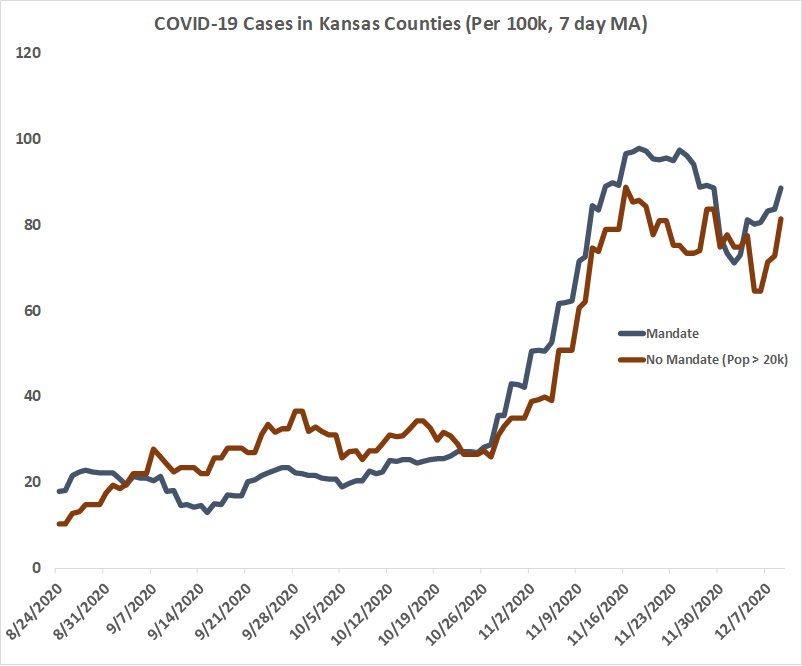
I won't say those counties did "better" at peak for the same reason I won't say they did "worse" prior to the November spike. There are other things that would need to be accounted for. What the takeaway should be is the *trend* - both rose/peaked/declined at the same time.
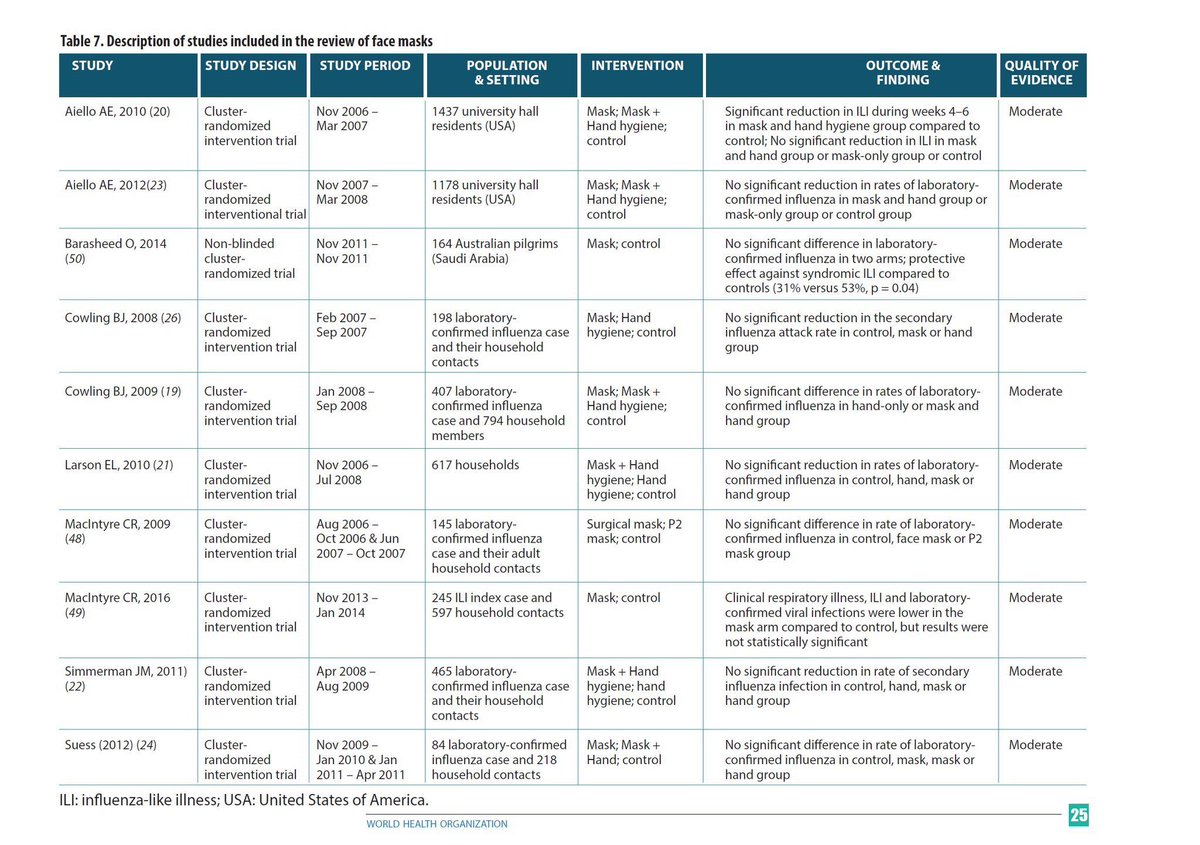
When the scientific evidence (read: RCT studies) pre-COVID hysteria overwhelmingly said universal masking was not effective in stopping respiratory viruses…should we really be surprised if it's the same story for *this* respiratory virus? Image
As Dr. Joseph Ladapo says in his WSJ piece, the mask obsession is a damaging distraction from the pandemic reality - viruses spread, and scientists' insane effort to prove masks work takes up valuable time that could be used on far more important issues. wsj.com/articles/masks…

• • •

Missing some Tweet in this thread? You can try to force a refresh
 

Keep Current with Eric

Eric Profile picture

Stay in touch and get notified when new unrolls are available from this author!

Read all threads

This Thread may be Removed Anytime!

PDF

Twitter may remove this content at anytime! Save it as PDF for later use!

Try unrolling a thread yourself!

how to unroll video
  1. Follow @ThreadReaderApp to mention us!

  2. From a Twitter thread mention us with a keyword "unroll"
@threadreaderapp unroll

Practice here first or read more on our help page!

More from @IAmTheActualET

11 Jan
The replies to her post, I just, I mean...wow
These would all be hilarious if it weren’t just so sad
Read 4 tweets
9 Jan
Tom claims COVID spread is entirely because of noncompliance with COVID measures, but he’ll never explain how 9 Midwest states peaked within one week of each other despite having completely different COVID policies, or how South Dakota managed to be the first to peak among them Image
Tom just hand-waves California’s terrible COVID numbers with “places in CA haven’t masked and distanced”. Really? Where? When? How? Do you have studies? Anything? California has some of the highest mask compliance numbers in the country. Can you be more specific, @DrTomFrieden?
If Tom were actually scientifically-minded he’d show a real interest in how California continues to spike despite having very drastic measures, or how all these Midwest states follow the exact same trajectory. That can’t be explained by 40 million people all complying at once. Image
Read 7 tweets
18 Dec 20
1/ I really want to highlight how this #COVID19 graph from @KCMOHealthDept is a masterclass in either incompetence, narrative-spinning, or both. This is a bit niche with it being KC but I think it applies to health depts across the US. This is lying with graphs at its finest.
2/ First, the graph itself. They have it broken out as cumulative counts per month, as of 12/15. December is half over, so you can't compare it to other months, yet they highlight how far cases have fallen in all groups since November with a tiny blink-and-you-miss-it disclaimer.
3/ They wouldn't be wrong in assuming cases will be down in December though. But their argument falls apart when they credit 10 PM bar closures for the decline. The curfew was announced 11/16. Cases peaked 11/10 - 20 DAYS before we would see any meaningful effect from the curfew.
Read 10 tweets
16 Dec 20
3 weeks removed from when people started gathering for Thanksgiving, let's see how those #COVID19 "surge upon a surge" predictions by Fauci etc panned out for those of us in the Midwest. Colored lines indicate each state's peak. They all occurred within one week of each other.
2/ The "surge upon a surge" narrative has no basis in reality. COVID outbreaks are clearly regional, regardless of the restrictions put in place by a particular state. This is perfectly obvious when you break out the regions one at a time vs. nationally.
3/ 4 states with some of the most lax COVID restrictions of this group of 9 have the highest decreases from their peak - ND, IA, SD and NE. Some of these states introduced new restrictions, mandates etc. but none of them align with when they peaked. Many came after.
Read 9 tweets
15 Dec 20
Still waiting on that contact tracing data for KC restaurants and bars. What % of outbreaks can you trace to them? Why haven't you shared this when you have 9 months of data?

A well-documented anecdote (3 infections) does not mean this is happening everywhere all the time.
"Necessary curbs", @QuintonLucasKC says, but provides no specifics, no data for Kansas City to show why this is necessary. These are the actions of someone desperate to look like he's doing something even if it's not empirically driven.
Also, cases are decreasing in KC as they are throughout the rest of the Midwest. @QuintonLucasKC announced his "Safer at Home KC" measures on 11/16. Cases peaked around 11/10. His policies are so effective they work retroactively!
Read 4 tweets
6 Nov 20
Anatomy of a standard #COVID19 response:
1. Recommend cancellation of elective procedures, causing financial strain on hospitals which in turn results in layoffs
2. Vastly overestimate the efficacy of masks and mask mandates, creating overreliance on unproven prevention methods
3. "Cases" eventually go up anyway (highly contagious+PCR tests), public officials blame the public for not "following the rules" re: masks
4. Layoffs from step 1 result in reduced number of beds that can be staffed when virus inevitably peaks, straining hospital workers
5. Media provide anecdotal horror stories of hospitals filling up but does not accurately reflect the big picture of the number of hospital beds available in an area
6. Virus spread eventually slows, regardless of what NPIs were put in place and at what time
Read 4 tweets

Did Thread Reader help you today?

Support us! We are indie developers!


This site is made by just two indie developers on a laptop doing marketing, support and development! Read more about the story.

Become a Premium Member ($3/month or $30/year) and get exclusive features!

Become Premium

Too expensive? Make a small donation by buying us coffee ($5) or help with server cost ($10)

Donate via Paypal Become our Patreon

Thank you for your support!

Follow Us on Twitter!