The next 3 tweets will show you that all you need is a clean chart (no indicators) a ruler and a pencil to identify a possible trend period to profit from.

Before we start, our template:

1 year of data on daily scale
Candlestick chart
(my preference white background)
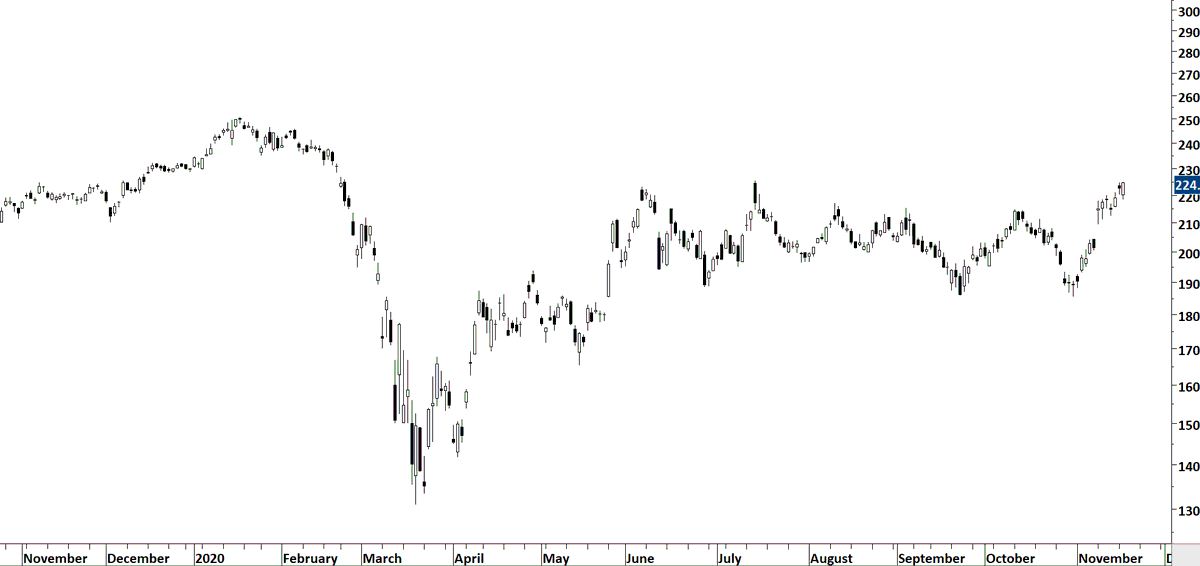
When you open your chart you will see this. Are you able to identify the lengthy and sideways consolidation?

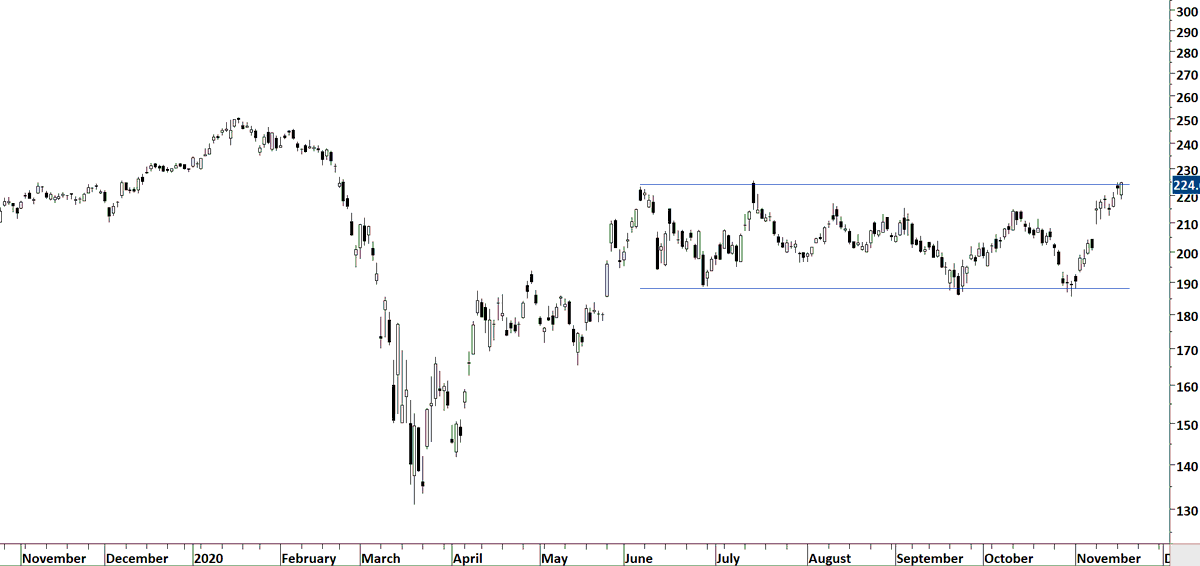
Are you able to draw horizontal boundaries that will be a well-defined rectangle?

Consolidations are usually followed by trend periods. We want to capture that.
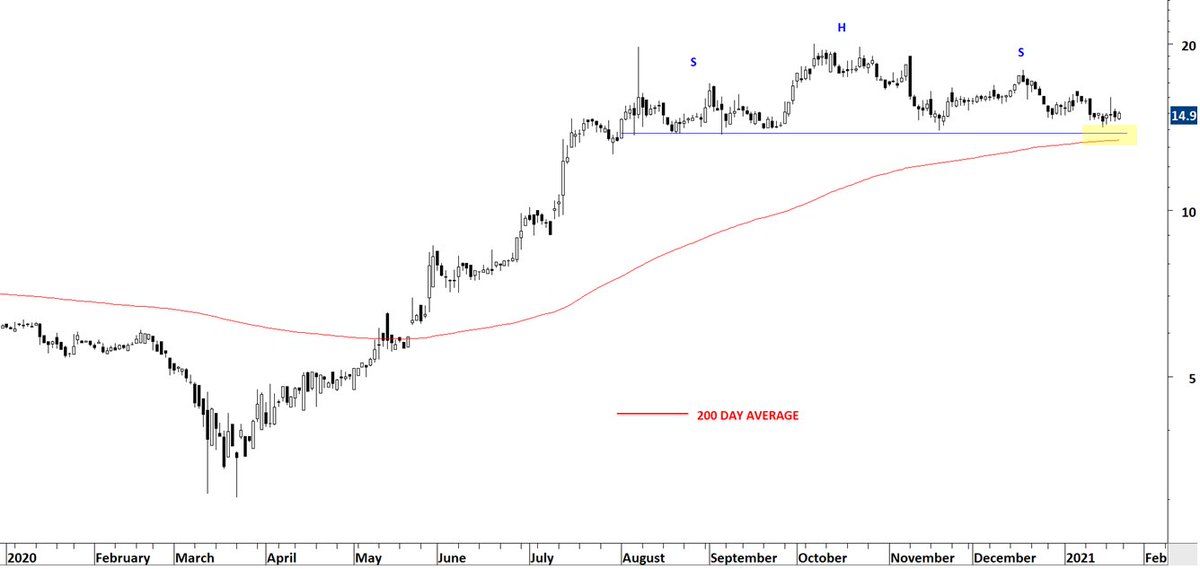
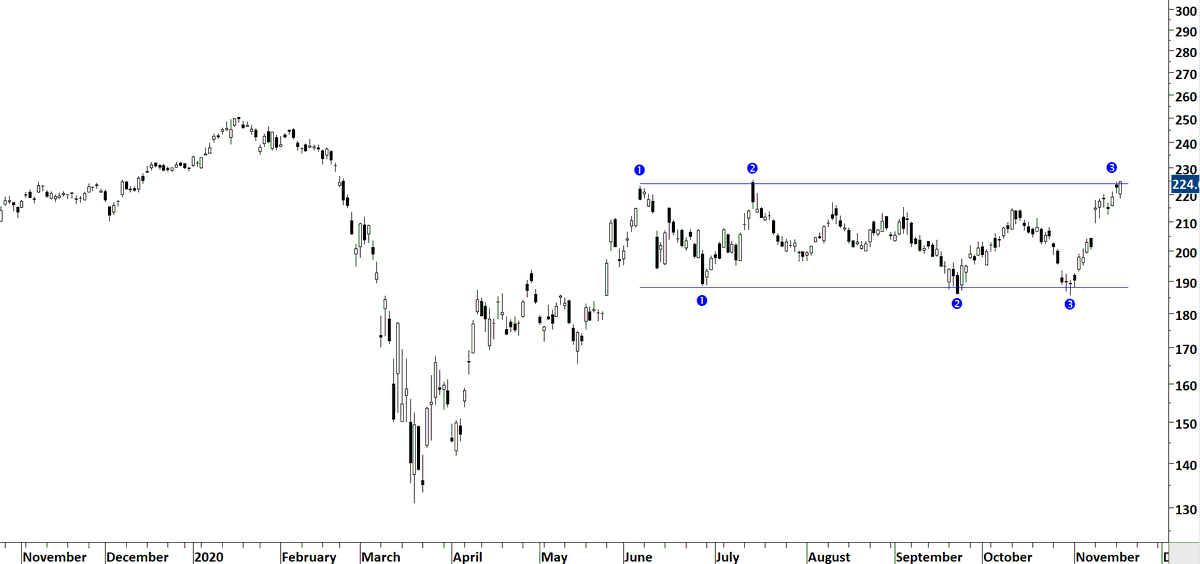
Did you draw the boundaries like this? Do we have several tests?
Several touch points to the pattern boundaries. We now want to see a breakout from this consolidation. Leave the worry of a failed breakout to the side. We can't know if a breakout will fail or not. We are now at the "Leap of faith" stage.
Breakout with white bodied candlesticks.
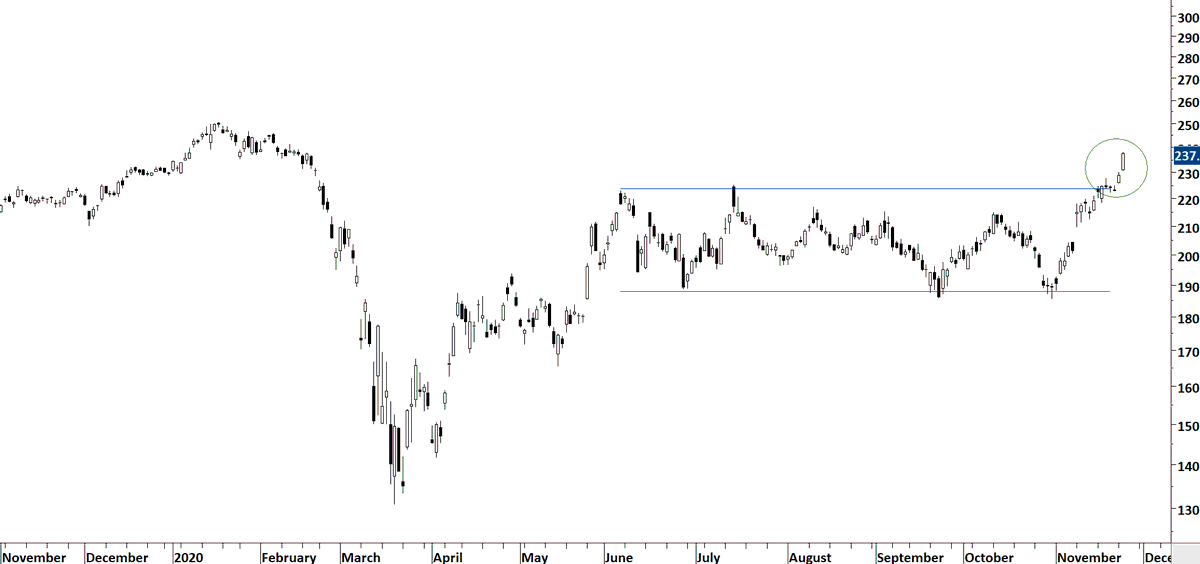
Leap of faith is the belief that breakout will work out. A protective stop-loss should be placed below the well-defined chart pattern boundary.
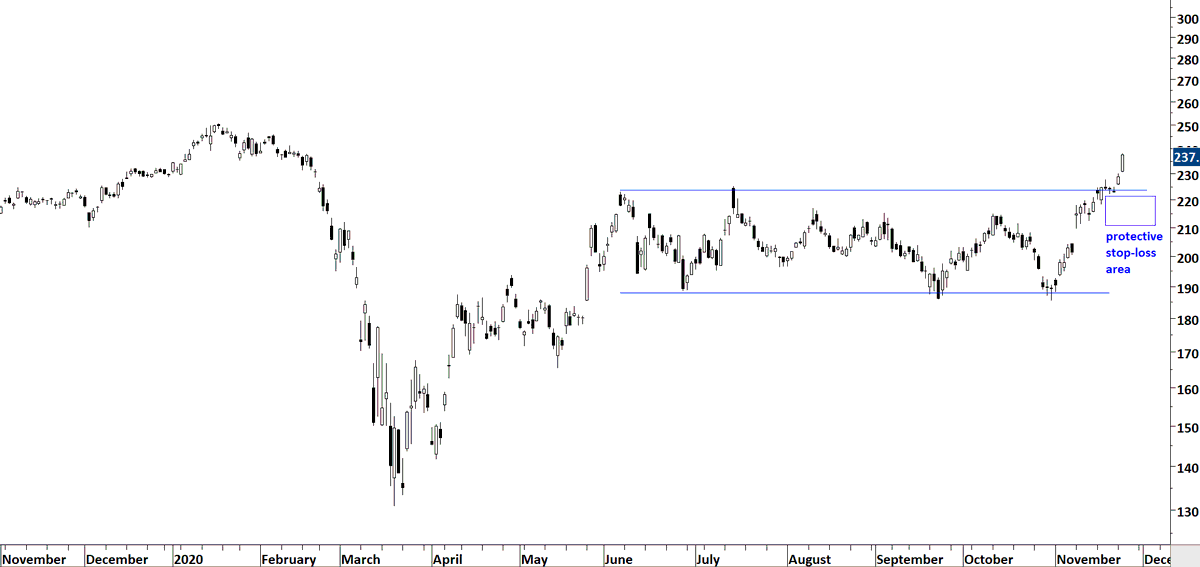
We have successfully identified the "consolidation" period which allowed us to be prepared for the next "trend" period.

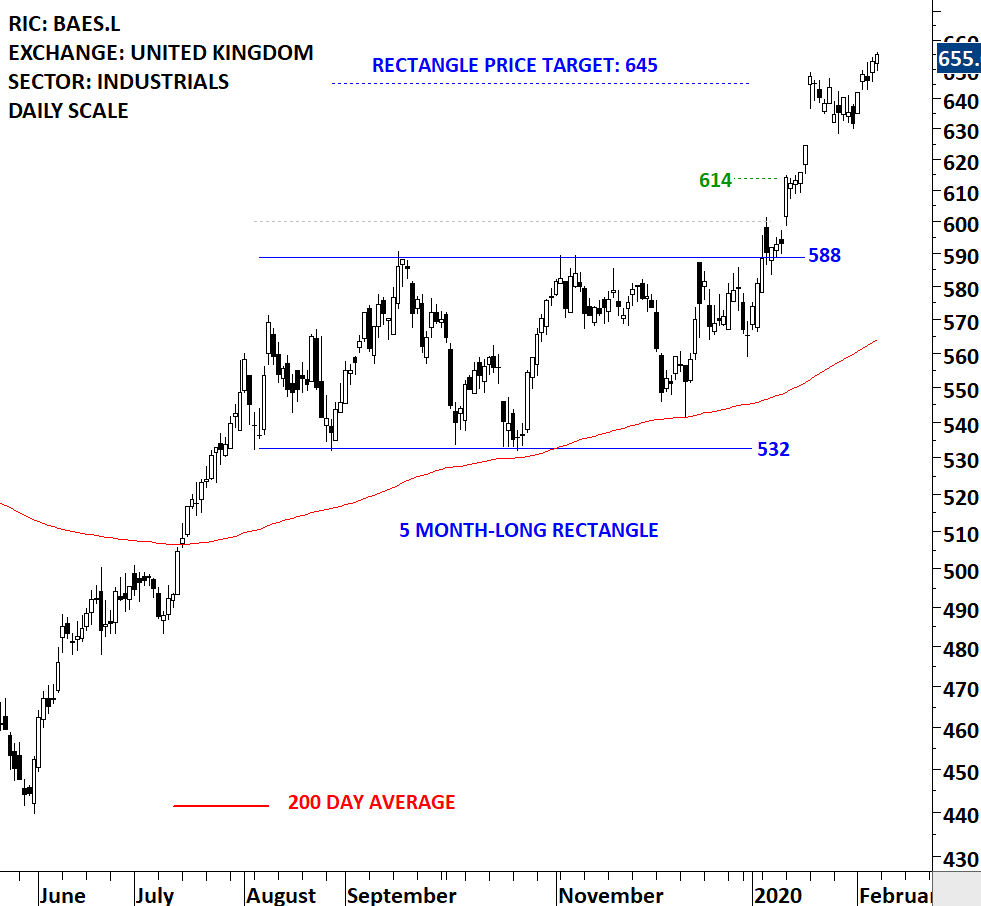
This was the chart of $GS a recent #breakout #alert from #GLOBAL #EQUITY #MARKETS report.

I followed the same steps above to capture this.
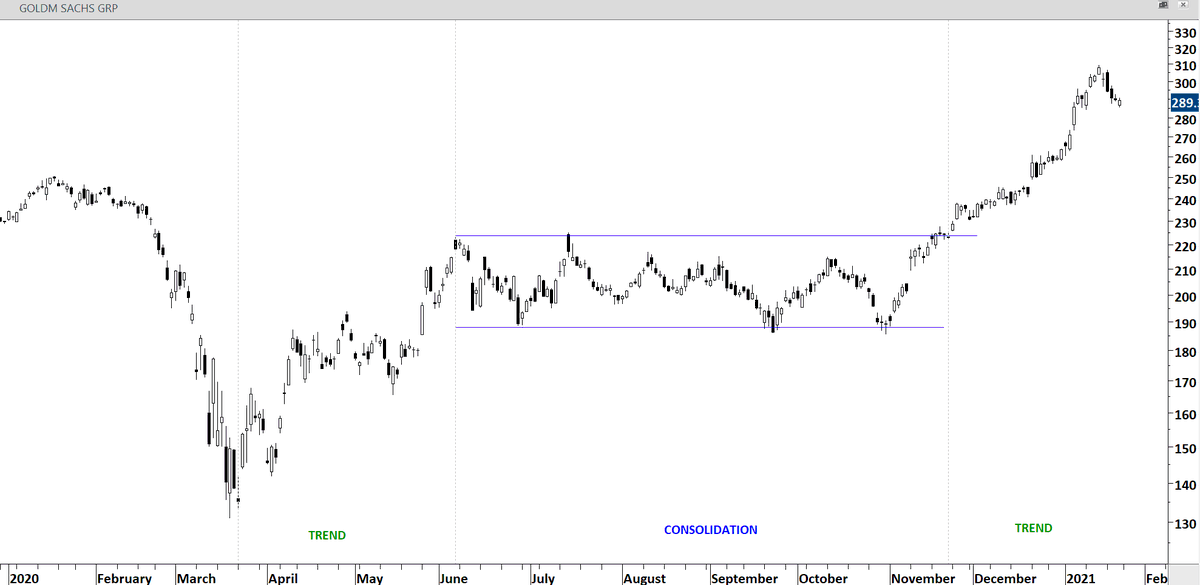
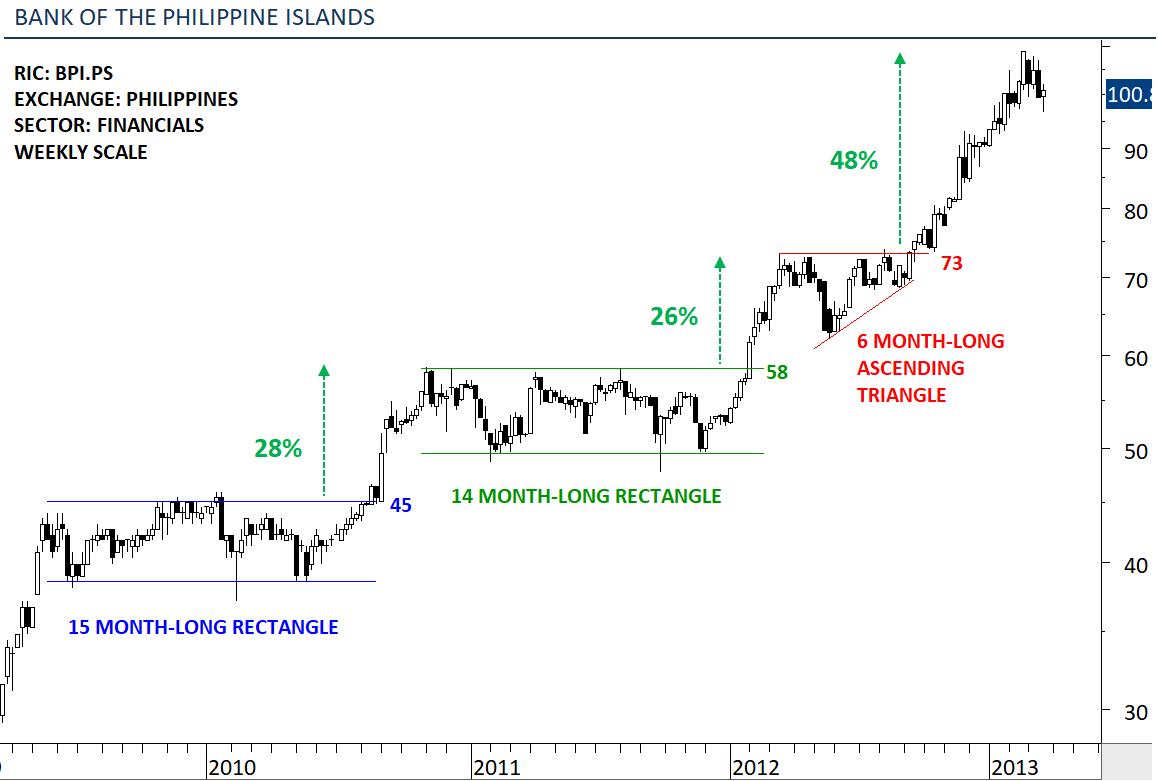
Chart patterns are actually periods of consolidations. Our job is to identify those consolidation periods so that we can take advantage of the following trend periods.

• • •

Missing some Tweet in this thread? You can try to force a refresh
 

Keep Current with Aksel Kibar, CMT

Aksel Kibar, CMT Profile picture

Stay in touch and get notified when new unrolls are available from this author!

Read all threads

This Thread may be Removed Anytime!

PDF

Twitter may remove this content at anytime! Save it as PDF for later use!

Try unrolling a thread yourself!

how to unroll video
  1. Follow @ThreadReaderApp to mention us!

  2. From a Twitter thread mention us with a keyword "unroll"
@threadreaderapp unroll

Practice here first or read more on our help page!

More from @TechCharts

23 Jan
I like to combine classical charting signals with the trend filter (200-day average). A breakdown should take place below the 200-day average and a breakout should take place above the 200-day average.

I.e. breakdown of the neckline will also clear the 200-day average.
Here is a good example where the long-term trend dictated the direction of the breakout. Failure to complete the H&S top and breakdown below the 200-day average acted as a great long signal with the breach of right shoulder high.
Edwards & Magee in their book Technical Analysis of Stock Trends, discussed the H&S failure with this example from 1936. Classical chart patterns are timeless.
Read 5 tweets
14 Apr 20
Currently charts I'm paying close attention to has similar patterns as the one below (name is not important).

From a classical charting + technical analysis perspective I will discuss 3 different inflection points and strategies.
1⃣ Stock completes a H&S top from low volatility condition. Breakdown takes place below the 200-day average. A sell signal (classical charting principles)
2⃣ Stock re-tests lows. Possibility of double bottom but very early stages. A possible buy signal can be justified with only using technical analysis (support/resistance concept). Buy at support, sell at resistance.

This is not a breakout strategy. A mean reversion strategy.
Read 5 tweets
21 Feb 20
You can utilize chart patterns in two different ways.

1) Trade price between well-defined boundaries (need to find a clear chart pattern at early stages)

2) Trade breakouts through chart pattern boundaries

I favor 2.
Following examples will highlight why I favor:

1⃣Breakout strategies
2⃣Horiozontal chart pattern breakouts
3⃣Rectangle setups with several tests of chart pattern boundary
BAE SYSTEMS. Breakout after several tests of well-defined horizontal boundary. No pullback and challenge to chart pattern boundary. Bullish continuation completing above 200-day. #RECENT #BREAKOUT #ALERT #UK #FTSE
Read 9 tweets
9 Feb 20
There are 4⃣ type of #BREAKOUTS

1⃣Breakout without any retest
2⃣Breakout with a re-test
3⃣Breakout with a hard re-test
4⃣Failed breakout

Following tweets explain each one of those with examples from recent breakout alerts
1⃣ Breakout without any retest

If you have a stop-loss placed below the chart pattern boundary, this is the easiest to trade. Following the breakout your stop-loss will no be challenged and price target will be met.

#BAES #FTSE #UK
2⃣ Breakout with a re-test

If you have a stop-loss placed below the chart pattern boundary, this type of trade may test your patience but still will not challenge your protective stop-loss. Chart pattern boundary will even offer a new entry opportunity.

$NDAQ $QQQ
Read 11 tweets
30 Nov 19
A prominent technical analyst expert on P&F charting has commented on one of my H&S continuation post. If you are having difficulty to understand H&S continuation, you are not alone. I will review few charts and draw your attention to the dynamics behind price action.
Because more than what each chart pattern is named, it is more important to understand what the price action is trying to tell us. You can name it a H&S continuation, Cup & Handle, Darwas Box etc.
First, I will share the best of best H&S continuation chart pattern I traded when I was working for the semi-sovereign fund in Abu Dhabi. Since it has been more than a year I can disclose, we have doubled our investment of $20 million. People familiar can confirm.
Read 13 tweets
8 Nov 19
1) There are different parts in successful trading/investing. One of them is trade identification/analysis. While there might be other parts such as position sizing, trade management, psychology, one should be as consistent as possible while dealing with each part.
2) When identifying chart patterns consistency is key. There is a tendency to see patterns when actually they don't exist. A good way to avoid this is to focus on successful chart pattern completions and keep on looking for similar setups.
3) I.e. H&S bottom reversal should form after a downtrend. Preferably the chart pattern should have a horizontal neckline and symmetry between the right and left shoulder. Breakout should clear not only the neckline but also the 200-day average.
Read 7 tweets

Did Thread Reader help you today?

Support us! We are indie developers!


This site is made by just two indie developers on a laptop doing marketing, support and development! Read more about the story.

Become a Premium Member ($3/month or $30/year) and get exclusive features!

Become Premium

Too expensive? Make a small donation by buying us coffee ($5) or help with server cost ($10)

Donate via Paypal Become our Patreon

Thank you for your support!

Follow Us on Twitter!