
A prominent technical analyst expert on P&F charting has commented on one of my H&S continuation post. If you are having difficulty to understand H&S continuation, you are not alone. I will review few charts and draw your attention to the dynamics behind price action.
Because more than what each chart pattern is named, it is more important to understand what the price action is trying to tell us. You can name it a H&S continuation, Cup & Handle, Darwas Box etc.
First, I will share the best of best H&S continuation chart pattern I traded when I was working for the semi-sovereign fund in Abu Dhabi. Since it has been more than a year I can disclose, we have doubled our investment of $20 million. People familiar can confirm. 

At the time, if I'm not wrong India Central Bank was buying a huge quantity. The breakout took place with a strong weekly candlestick. The right shoulder of the H&S continuation was an #ascendingtriangle
I am following Richard Schabacker's and Edwards & Magee's book on classical charting principles. This example is featured on Edwards & Magee 5th edition from 1936. A H&S continuation.

This was a breakout that was featured on Tech Charts. Is it similar to all the other H&S continuation chart patterns.
1) Prior uptrend.
2) Series of swings that take the form of H&S bottom.
3) A well-defined several times tested horizontal boundary.
4) Breakout
1) Prior uptrend.
2) Series of swings that take the form of H&S bottom.
3) A well-defined several times tested horizontal boundary.
4) Breakout
This was another H&S continuation that was featured on Tech Charts. Similarities?

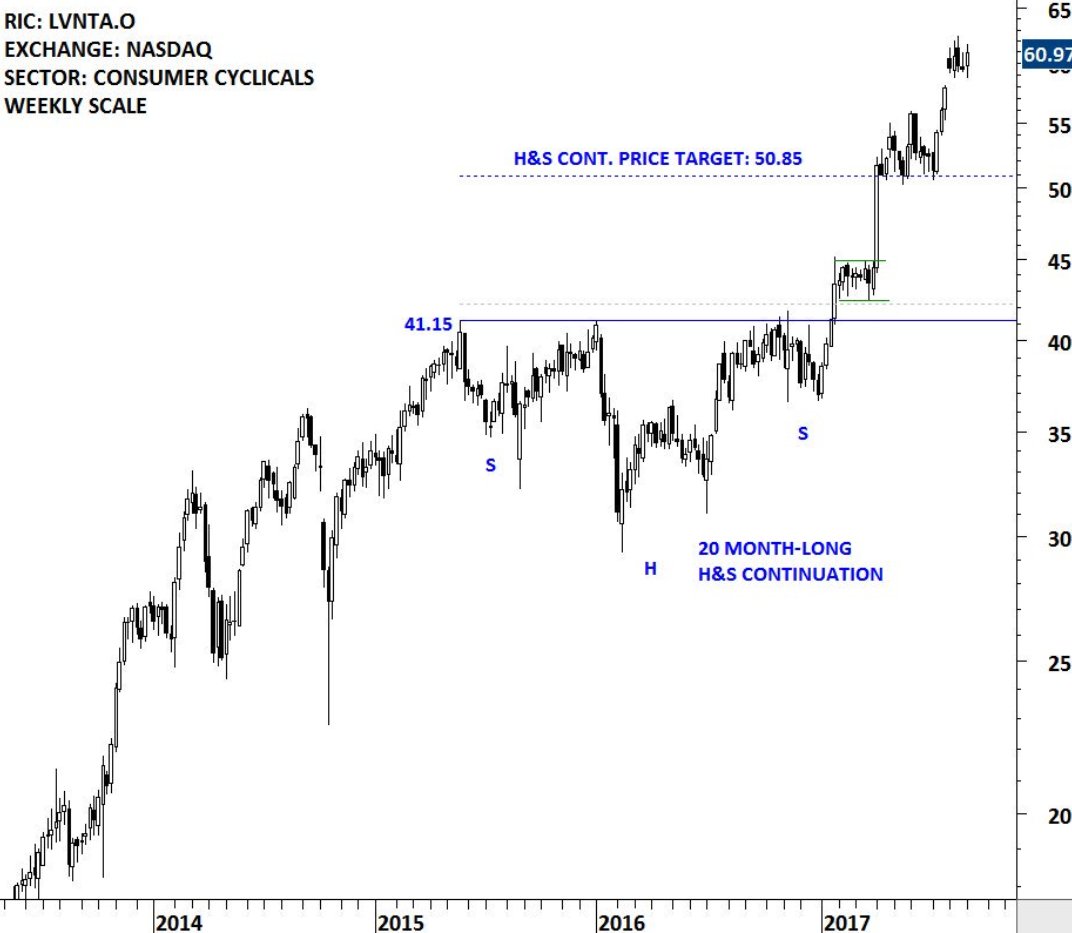
And this here was another breakout alert that was labelled as H&S continuation. Again, prior trend up, then a lengthy consolidation followed by a breakout above the horizontal boundary.

Last but not least another breakout alert from Tech Charts Global Equity Markets report.
Now let's discuss the dynamics behind the price action rather than the names given to those patterns...
Now let's discuss the dynamics behind the price action rather than the names given to those patterns...

The key point here with H&S bottoms reversals and continuations is the higher low that it makes after an increase in volatility (During the Head).
It shows that the market is finding a balance. In other words entering into a low volatility period. In other words finding bids.
It shows that the market is finding a balance. In other words entering into a low volatility period. In other words finding bids.
With Cup & Handle we have the same dynamics. It is just missing the left shoulder. But most important is the price action to the right side of the chart where price forms a higher low than the head or the cup.
That prepares the chart for a breakout.
That prepares the chart for a breakout.
The right shoulder can take the form of another bullish chart pattern which increases the conviction of a breakout when it takes place. In the Gold example below, the right shoulder was an ascending triangle.

Speaking of price dynamic behind chart patterns, similar to cup & handle, H&S continuation, H&S reversal, the ascending triangle has higher lows which makes the chart pattern attractive for bulls.


