There are 4⃣ type of #BREAKOUTS
1⃣Breakout without any retest
2⃣Breakout with a re-test
3⃣Breakout with a hard re-test
4⃣Failed breakout
Following tweets explain each one of those with examples from recent breakout alerts
1⃣Breakout without any retest
2⃣Breakout with a re-test
3⃣Breakout with a hard re-test
4⃣Failed breakout
Following tweets explain each one of those with examples from recent breakout alerts
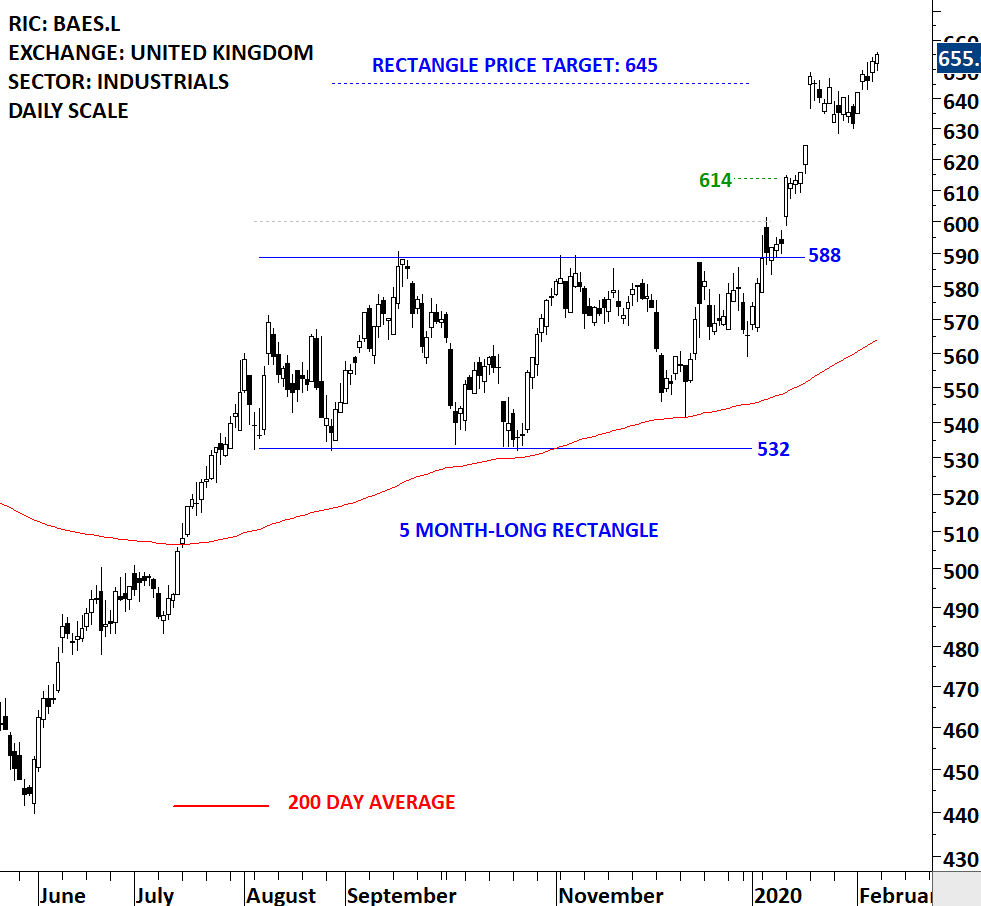
1⃣ Breakout without any retest
If you have a stop-loss placed below the chart pattern boundary, this is the easiest to trade. Following the breakout your stop-loss will no be challenged and price target will be met.
#BAES #FTSE #UK
If you have a stop-loss placed below the chart pattern boundary, this is the easiest to trade. Following the breakout your stop-loss will no be challenged and price target will be met.
#BAES #FTSE #UK
2⃣ Breakout with a re-test
If you have a stop-loss placed below the chart pattern boundary, this type of trade may test your patience but still will not challenge your protective stop-loss. Chart pattern boundary will even offer a new entry opportunity.
$NDAQ $QQQ
If you have a stop-loss placed below the chart pattern boundary, this type of trade may test your patience but still will not challenge your protective stop-loss. Chart pattern boundary will even offer a new entry opportunity.
$NDAQ $QQQ

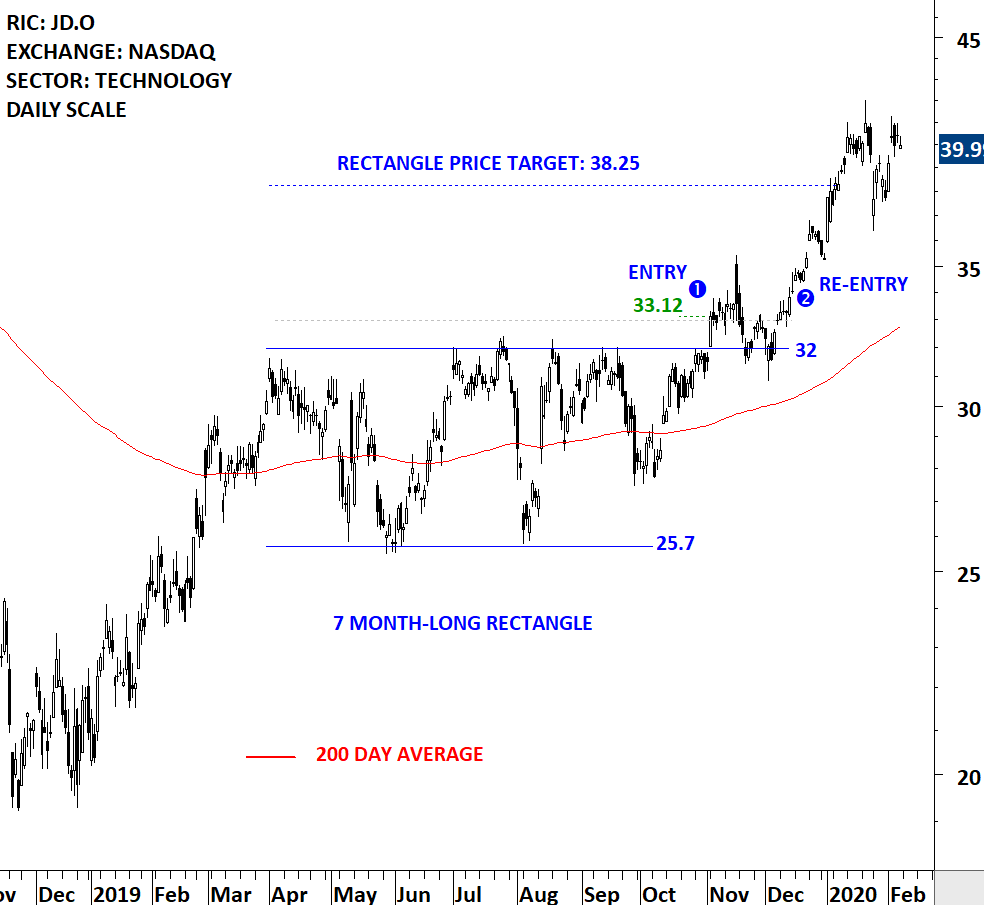
3⃣ Breakout with a hard re-test
If you have your stop-loss below the chart pattern boundary and it is a tight stop-loss, you might get stopped out depending on the hard re-test.
A trading tactic to re-enter: immediately after price recovers above pattern boundary
$JD $QQQ
If you have your stop-loss below the chart pattern boundary and it is a tight stop-loss, you might get stopped out depending on the hard re-test.
A trading tactic to re-enter: immediately after price recovers above pattern boundary
$JD $QQQ
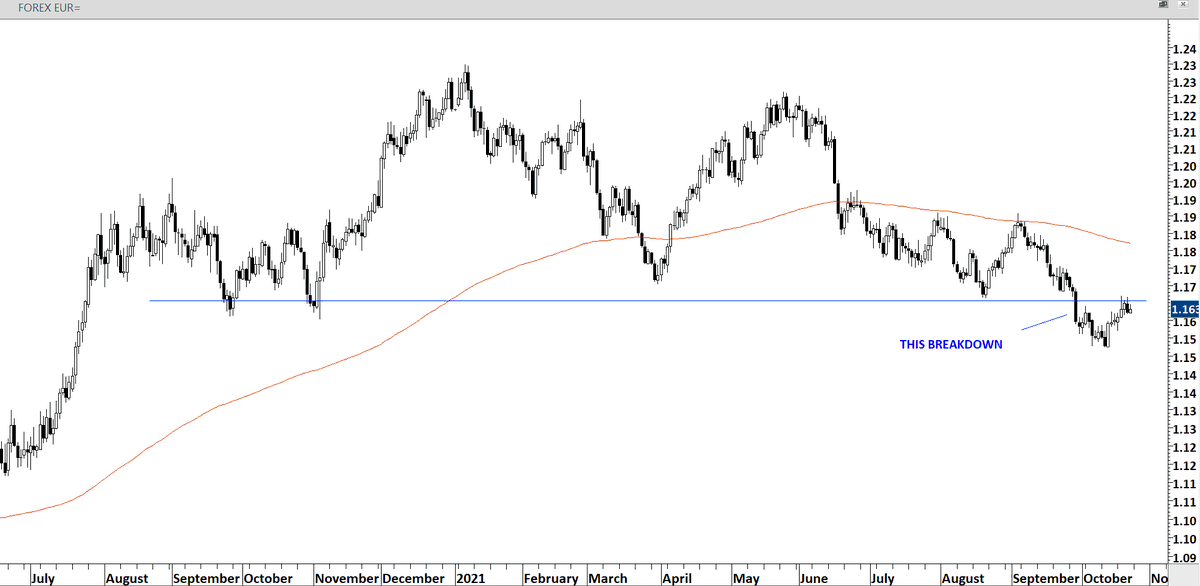
4⃣ Failed breakout
If you have your stop-loss below the chart pattern boundary, price will fail to hold the breakout level and you will get stopped out. These are part of trading breakouts. It is important to always have protective stops (BELOW PATTERN BOUNDARY) in place.
$INCY
If you have your stop-loss below the chart pattern boundary, price will fail to hold the breakout level and you will get stopped out. These are part of trading breakouts. It is important to always have protective stops (BELOW PATTERN BOUNDARY) in place.
$INCY

There is no perfect stop-loss strategy.
There is no perfect indicator that will warn you of failed breakouts and improve your win rate.
There is "leap of faith" 'courage to pull the trigger" with those breakouts.
There is managing risk via protective stops and position sizing.
There is no perfect indicator that will warn you of failed breakouts and improve your win rate.
There is "leap of faith" 'courage to pull the trigger" with those breakouts.
There is managing risk via protective stops and position sizing.
A recent breakout alert on $AUY YAMANA GOLD is a good example to feature the breakout with a hard retest
Even though the price held above chart pattern negation level, it dipped below the pattern boundary
Those who had tight stops had a chance for re-entry with renewed strength
Even though the price held above chart pattern negation level, it dipped below the pattern boundary
Those who had tight stops had a chance for re-entry with renewed strength

Wouldn't it be great after a breakout if the pattern boundary was not challenged at all? Unfortunately we have to deal with different type of breakouts. Out of those 2 are easier to manage than the rest.
1⃣Breakout without any retest
2⃣Breakout with a retest
Examples follow...
1⃣Breakout without any retest
2⃣Breakout with a retest
Examples follow...
1⃣Breakout without any retest
A recent breakout alert. A good example to highlight the importance of acting at the time of the breakout.
#SMI SONOVA HEALTHCARE #SWITZERLAND
A recent breakout alert. A good example to highlight the importance of acting at the time of the breakout.
#SMI SONOVA HEALTHCARE #SWITZERLAND

2⃣Breakout with a retest
This is another type of #breakout that initial protective stops placed below the pattern boundary are not challenged.
Another relatively easy #breakout to manage.
This is another type of #breakout that initial protective stops placed below the pattern boundary are not challenged.
Another relatively easy #breakout to manage.

Depending on your trading tactics/tight stop-losses these are relatively difficult #breakout conditions to manage. Hard re-tests are challenging.
https://twitter.com/TechCharts/status/1226606251422998534
• • •
Missing some Tweet in this thread? You can try to
force a refresh