why is LULUCF (land-use, land-use change & forestry) excluded?
1. measurement methodologies aren't standard between countries & frequently change — no robust method to compare countries 2. annual fluctuations are high / noisy
3. the vast majority of australia's LULUCF variation is driven by changes to QLD land-clearing laws, a function of state political tussles, and nothing to do with commonwealth policy. 4. australia is famous for using LULUCF as a fudge, see @MichaelM_ACT:
in july only 213 of 720MW (30%) was subscribed.
subscriptions have since dropped to 104MW (14%)…
of the 36 towns in #nuscale's pilot project, the "carbon free power project" #CFPP:
• 8 towns have withdrawn entirely
• 24 reduced their share entitlement
• 3 maintained identical entitlement
• 1 joined (token level).
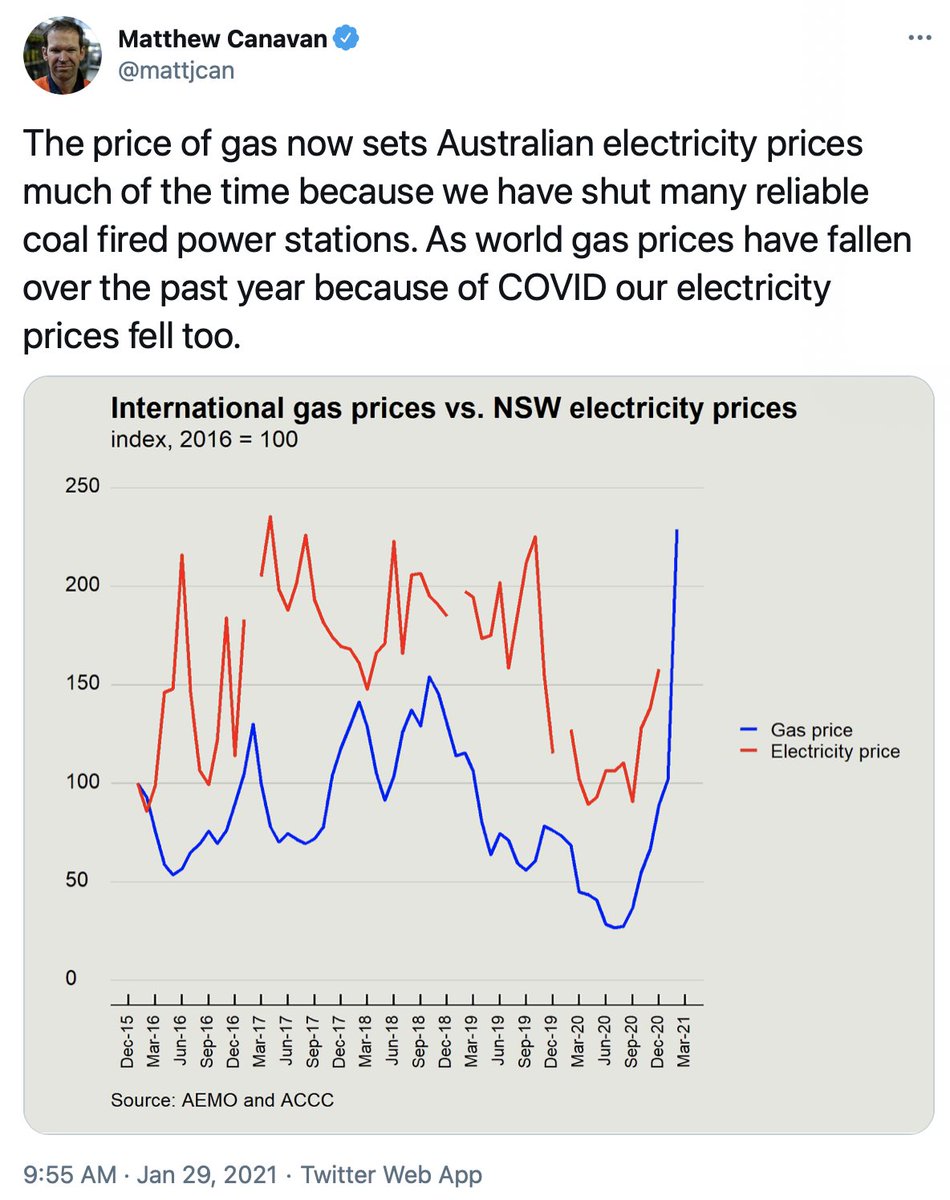
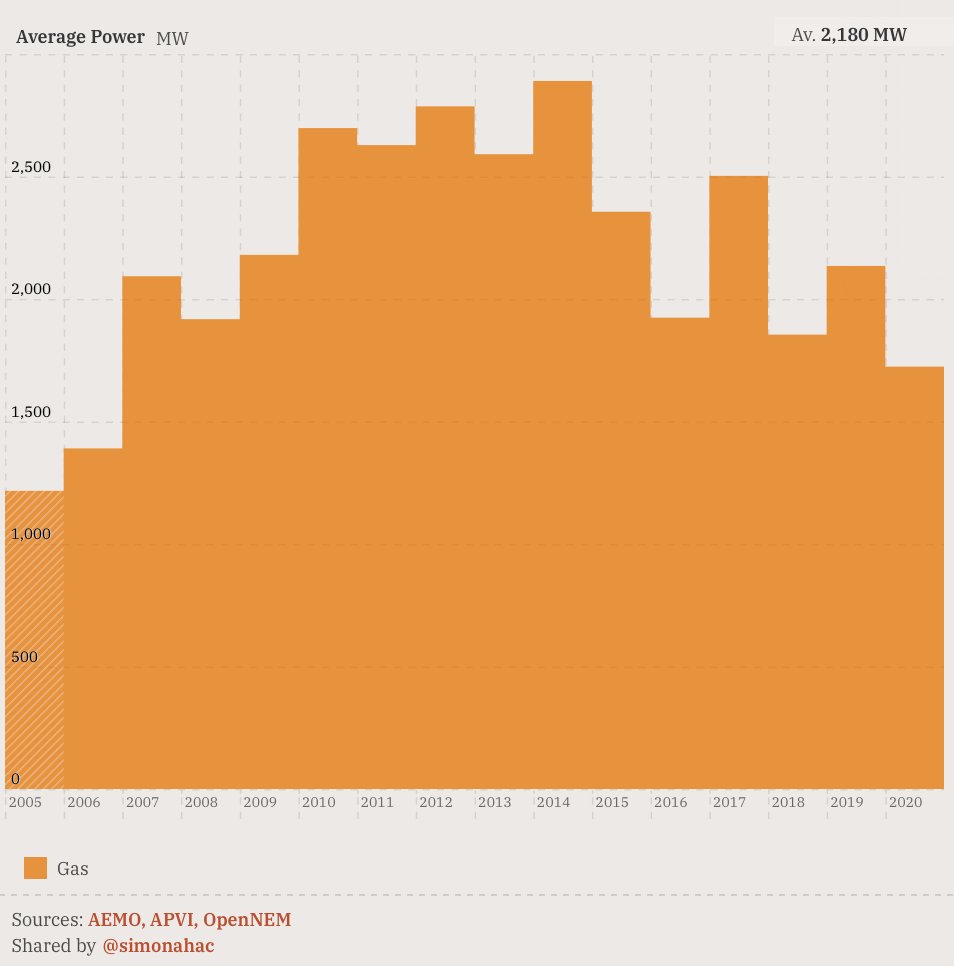
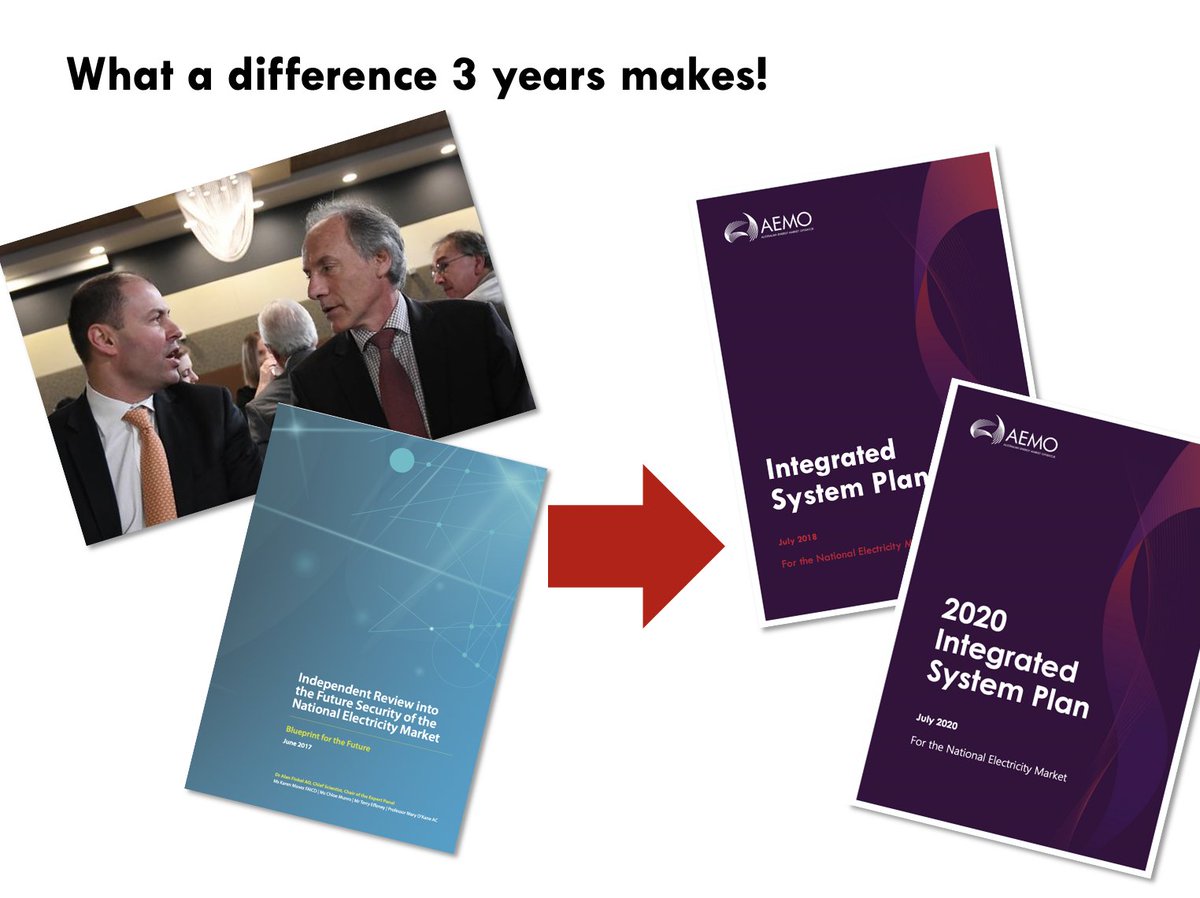
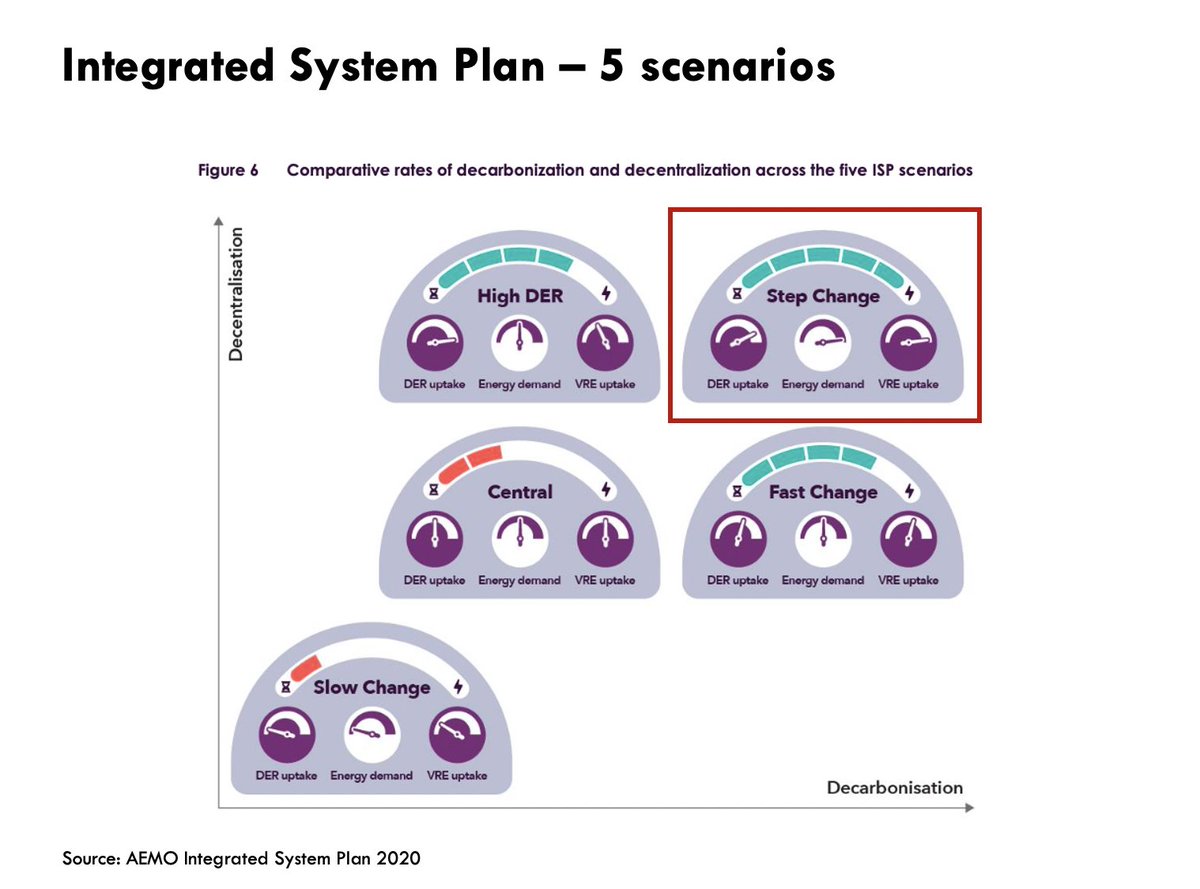
don't think of a scenario as a prediction, but rather a set of constraints/assumptions and the cheapest path found to supply power within those constraints.
let's talk about the 'step change' scenario.
'step change' is the closest to being compliant with the paris agreement — ie. a half-decent start if we want to keep the great barrier reef, not destroy civilisation etc.
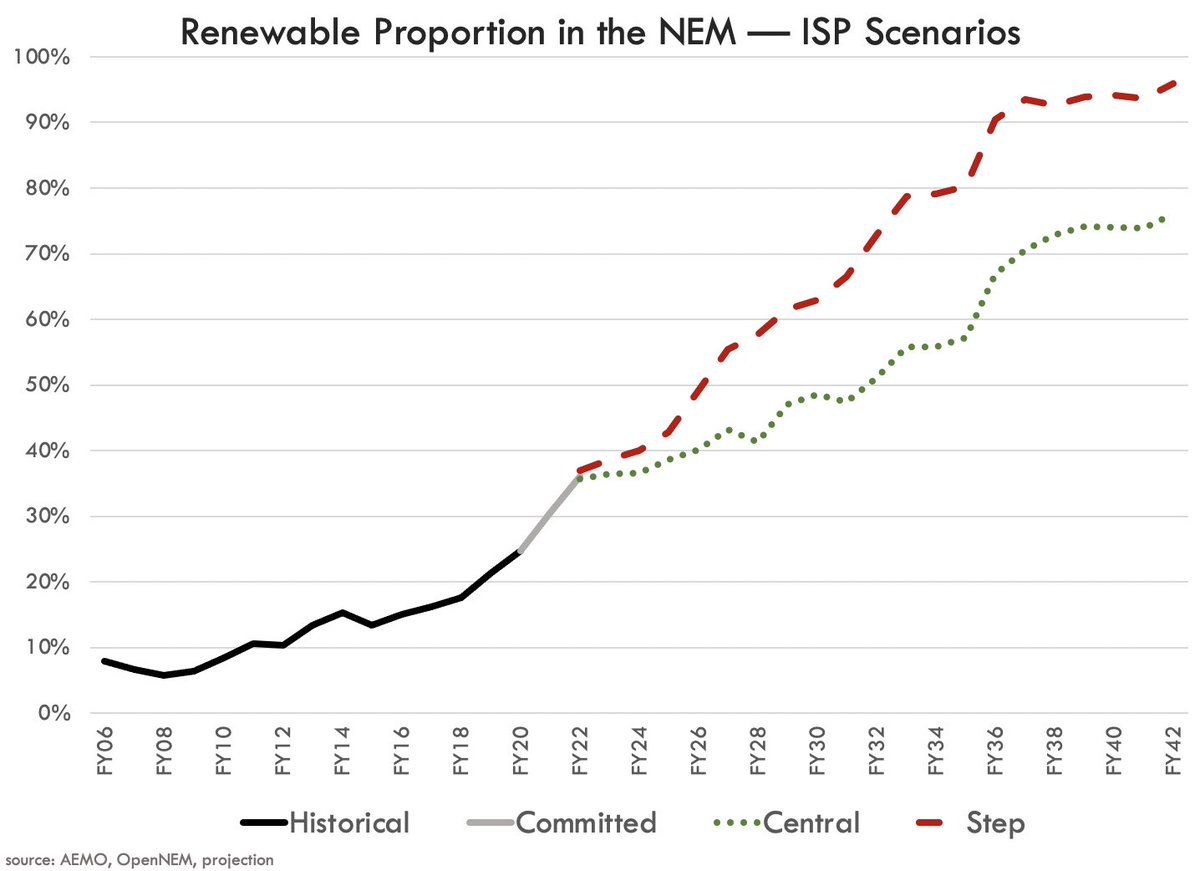
it gets us to 96% renewables in 2042.
(the central 'business as usual' scenario is a few years slower.)
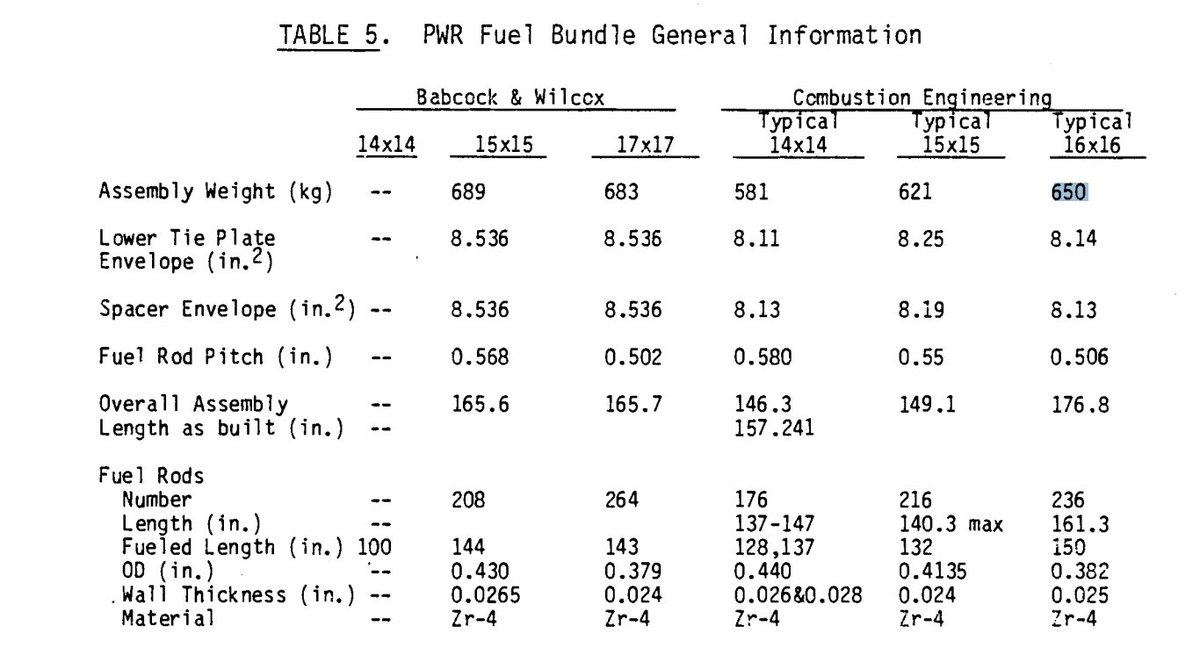
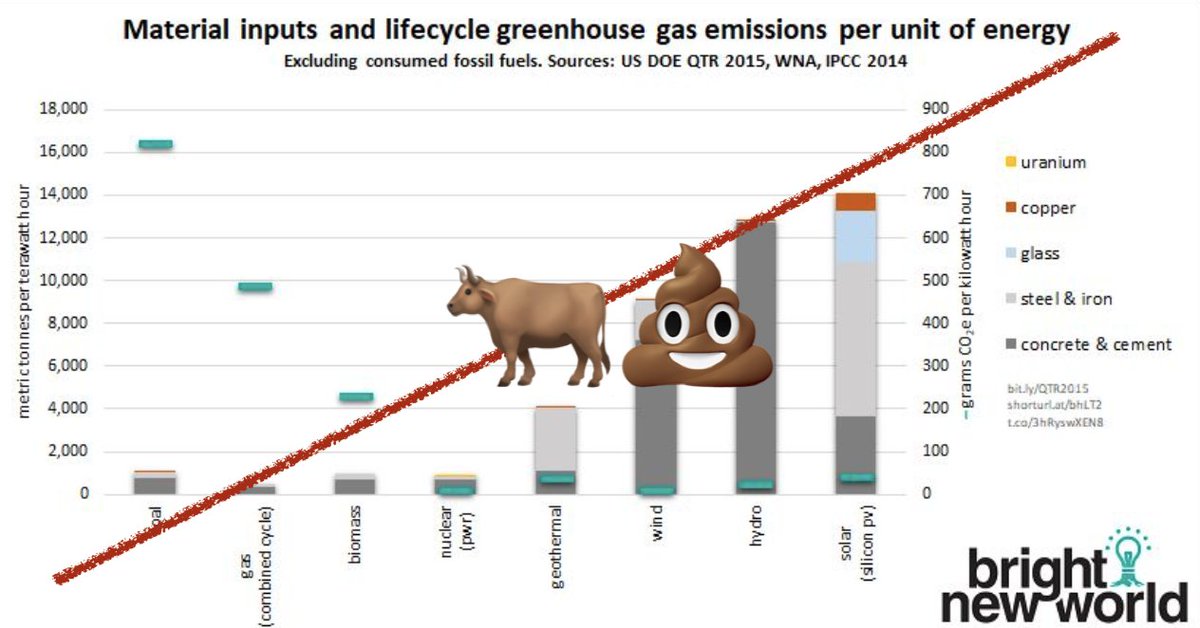
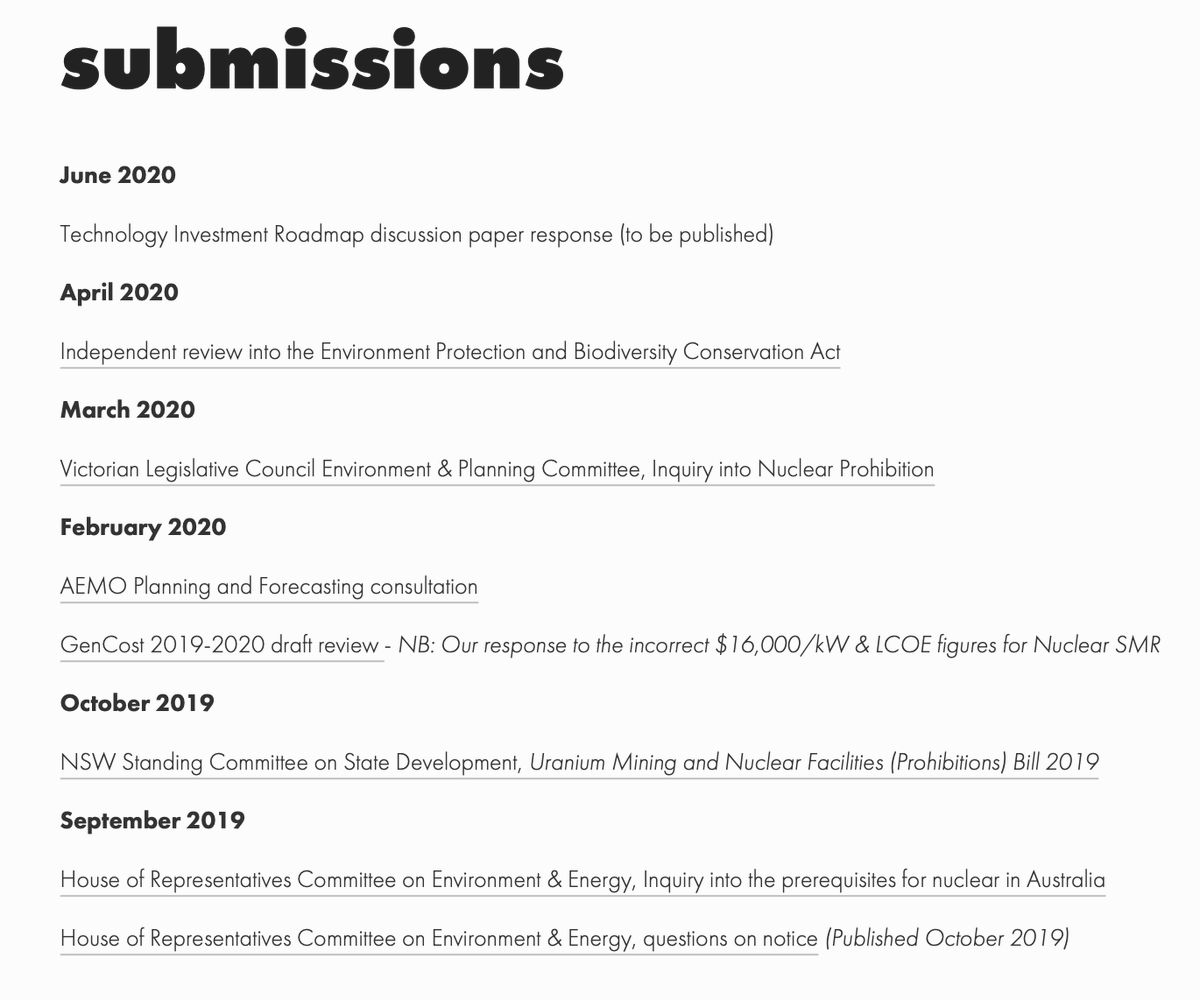
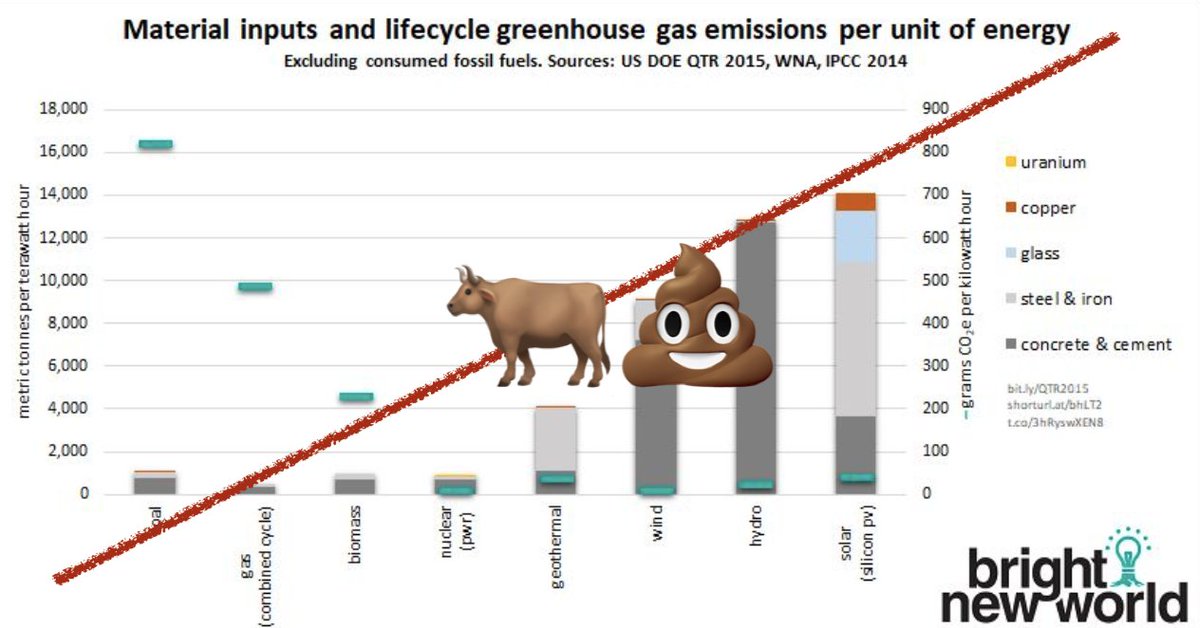
earlier this year adelaide-based nuclear lobby group @BNW_Aus submitted this chart (sans emoji) to the #victorian parliamentary inquiry into #nuclear prohibition.
one problem: it’s 🐂💩!
.@BNW_Aus claims to be an environment group, yet *all* they seem to do is fight against australia’s nuclear bans.
i’ve no problem with nuclear advocacy — nuclear technology is pretty amazing & we should keep our minds open — but why not just be honest & admit your sole purpose?
the chart aims to show that nuclear is awesome because it’s just so thrifty.
BNW's GM @dayne_eckermann says it’s relevant because “you need materials mined from the ground to make things. it's better if we limit that as much as possible to protect the environment”.