Quick Breakdown of the GDP Report:
Nominal GDP growth increased to -1.2% on a year over year basis.
This increase in nominal growth is clearly very expected.
1/
Nominal GDP growth increased to -1.2% on a year over year basis.
This increase in nominal growth is clearly very expected.
1/
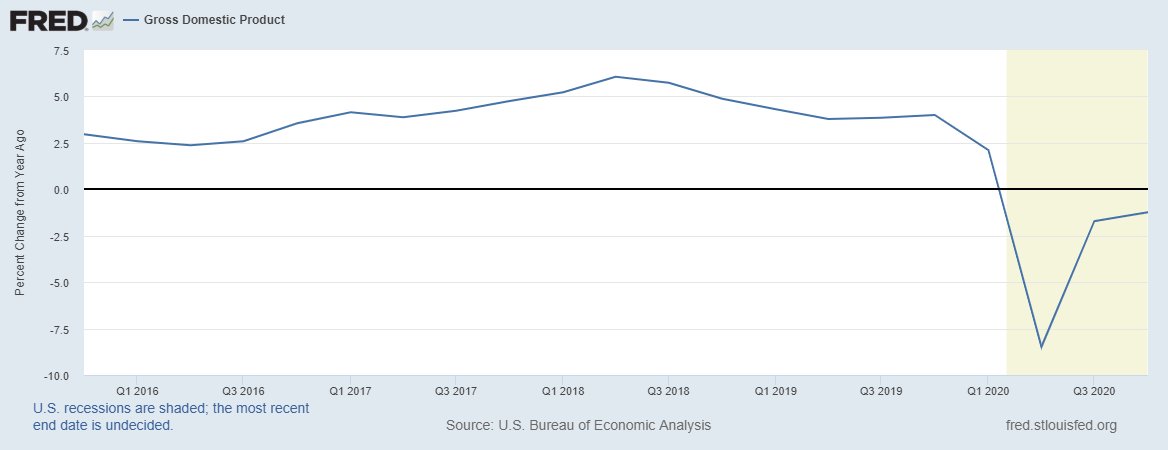
Real GDP growth increased just a touch, from -2.85% to -2.45% on a year over year basis.
The gains are predictably slowing (Zarnowitz Rule) but the y/y growth will look huge in Q2 due to the base.
2/
The gains are predictably slowing (Zarnowitz Rule) but the y/y growth will look huge in Q2 due to the base.
2/

Consumption as a % of GDP actually declined in Q4.
Consumption fell to 67% of total GDP, basically flat since the 2008 crisis.
3/
Consumption fell to 67% of total GDP, basically flat since the 2008 crisis.
3/

Government spending as a % of GDP fell to about 18%, down from almost 20% in Q2.
If consumption and government spending fell as a % of GDP, then what rose?
4/
If consumption and government spending fell as a % of GDP, then what rose?
4/

Private investment!
Private investment rose to 18% of GDP, the highest rate since before the 08 crisis.
The downtrend is still intact, but this rise is good, right?
5/
Private investment rose to 18% of GDP, the highest rate since before the 08 crisis.
The downtrend is still intact, but this rise is good, right?
5/

Sort of.
What drove the rise in investment? Residential.
It is good that residential investment increased - that is a high-velocity use of funds.
But we are in the middle of a major demographic shift out of cities and to suburbs so this increase is likely transitory
6/
What drove the rise in investment? Residential.
It is good that residential investment increased - that is a high-velocity use of funds.
But we are in the middle of a major demographic shift out of cities and to suburbs so this increase is likely transitory
6/

Also, the gains in residential investment is not coming from new income, it is coming at the expense of the cities - losses that are harder to capture in GDP.
So we are seeing the boost in GDP but the lost income and decline in building values are not easily captured.
7/
So we are seeing the boost in GDP but the lost income and decline in building values are not easily captured.
7/
The % of GDP coming from investment in actual structures and equipment barely budged and is at rock bottom levels.
This includes things like: hospitals, power plants, manufacturing plants, industrial supplies, transportation equipment, construction machinery, and more.
8/
This includes things like: hospitals, power plants, manufacturing plants, industrial supplies, transportation equipment, construction machinery, and more.
8/

The structures component is particularly troubling.
9/
9/

As of Q3 (not updated for Q4), net national savings was negative and are likely to stay negative or close to it.
So how do we have the resources for investment?
10/
So how do we have the resources for investment?
10/

A larger trade deficit.
Essentially, we can continue to run larger government budget deficits and consume until we drop.
We will only be able to have the ready resources for new investment if we run a larger trade deficit.
11/
Essentially, we can continue to run larger government budget deficits and consume until we drop.
We will only be able to have the ready resources for new investment if we run a larger trade deficit.
11/

In short, we can choose to have a collapse in investment or an explosion in the trade deficit.
Both have their consequences but those are our only options if we are unwilling to give up government spending and consumption.
12/
Both have their consequences but those are our only options if we are unwilling to give up government spending and consumption.
12/
Oh - and velocity fell.
13/13
13/13

• • •
Missing some Tweet in this thread? You can try to
force a refresh