We can calculate the historical contributions to current warming, but how does this change in the future as we follow different levels of mitigation? This needs scenarios...

A short thread our new paper...

1/

link.springer.com/article/10.100…
2. We use the Shared Socioeconomic Pathways (SSPs).

There are 5 SSPs, 6 forcing levels, & 6 IAMs. This is up to 180 realizations of future historical contributions, but their are 127 in practice as not all combinations were implemented or solvable.
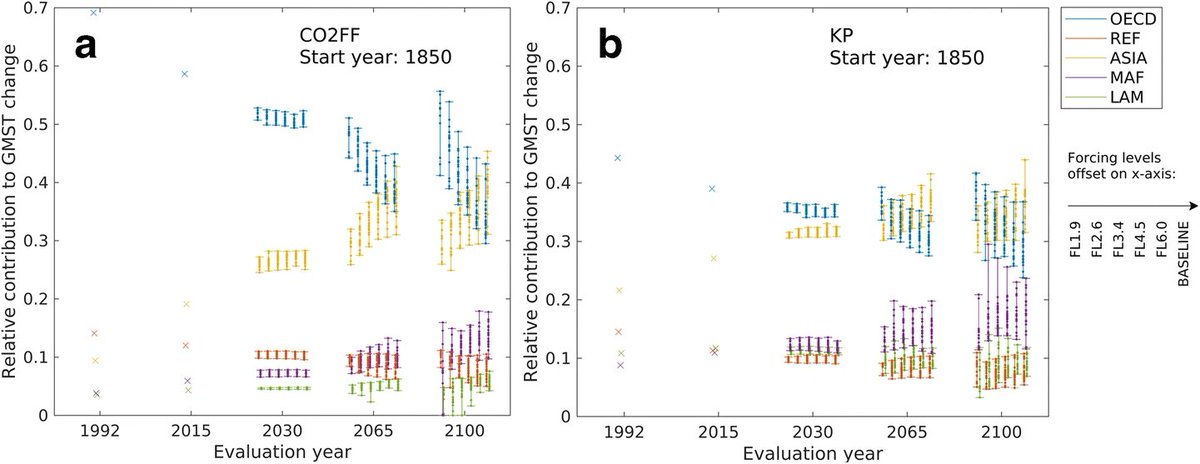
3. A challenge with historical contributions is to pick the start & end year.

Here is a start year of 1850 (CO₂ left, GHG right), with end-year:
* 1992, 2015: OECD high shares
...
* 2100: OECD share declines, more so in baselines (right bars) due to rise of Asia (yellow)
4. Surprising result #1: If we fix the end year at 2100, a start year of 2015 does not lead to much variation across forcing levels (bars are similar).

This implies that IAMs have a similar mitigation distribution in weak & deep mitigation. Regions maintain the same shares!
5. ...so if a start year of 1850 is taken, looking back from 2100, the regional distribution is due to the 1850-2015 period, not the 2015-2100 period (*assuming mitigation happens as in SSPs*).
6. Surprising result #2: For a start year 2015, end year 2100. There is basically no variation across SSP (left) or forcing level (middle), a little variation across IAM (right).

The SSPs include equity (in adaptation), but this does not propagate to mitigation.
7. Though, some IAMs lead to variations. On the right, some IAMs lead to large variation in historical contributions across forcing level (eg GCAM & IMAGE).

The IAM is more important than SSP or forcing level!
8. Historical contributions are somewhat controversial. They would imply more action from OECD.

But, the world is dynamic...

You would expect OECD shares to decline with mitigation & Asia to rise with growth, but IAMs use cost effective mitigation so that does not happen.
9. For future historical contributions (based on scenarios), IAMs (& the way policy is implemented) seem to be the biggest driver of variation in contributions.

I was suspecting more variation by SSP & forcing level, but in hindsight...
10. You can read the paper. We took out a mortgage to make it open access...
link.springer.com/article/10.100…

/end

• • •

Missing some Tweet in this thread? You can try to force a refresh
 

Keep Current with Glen Peters

Glen Peters Profile picture

Stay in touch and get notified when new unrolls are available from this author!

Read all threads

This Thread may be Removed Anytime!

PDF

Twitter may remove this content at anytime! Save it as PDF for later use!

Try unrolling a thread yourself!

how to unroll video
  1. Follow @ThreadReaderApp to mention us!

  2. From a Twitter thread mention us with a keyword "unroll"
@threadreaderapp unroll

Practice here first or read more on our help page!

More from @Peters_Glen

25 Jan
Yes, if you burn a lump of biomass & a lump of coal, the biomass emits more CO₂ (per kg).

That does not mean biomass is worse for climate (unless you are in with the coal lobby).

Coal takes millions of years to replace, biomass from years to centuries.

cicero.oslo.no/no/posts/klima…
When you grow a carrot, & eat it & respire CO₂, you don't march the streets complaining it is destroying the climate. The carrot grows back (& may even degrade the land), but it is essentially a closed cycle (otherwise the planet would have imploded millions of years ago).
If you grow an energy crop, with a rotation of 1 year, it is like growing a carrot. There may be losses in the life cycle emissions, as there is when harvesting & transporting a carrot. Likewise, the land may get degraded. Food production impacts the environment, also bioenergy!
Read 7 tweets
19 Jan
To say "the remaining carbon budget for 1.5°C is 440 GtCO₂" [add favorite number] is highly misleading

Taking a narrow 67–33% range, the value is 230–670 GtCO₂, but full range (left) could be −1000 - 2000 GtCO₂... (yes, could be negative or huge)

1/

nature.com/articles/s4324…
When I wrote "studies ranging from −100 to about 800 GtCO₂" back in 2018 I was being very conservative (there were no full uncertainty analyses then) rdcu.be/bHT2C

Good to see papers (now) being much more explicit about the uncertainty & range...

2/
I have problems with the remaining carbon budgets presented as a single number, instead of a range. Is there any other climate variable presented as a one-sided probability? The ECS, eg, is presented as a range.
rdcu.be/bHT2C

Good to see the authors use ranges!

3/
Read 6 tweets
18 Jan
THREAD: Sports Utility Vehicles (SUVs)

Global car sales shrank by ~14% in 2020
* Sales of electric cars grew ~50% (from a very low level)
* Sales of SUVs declined ~10%, but share of sales went from 39% to 42%

→ What about emissions from SUVs?

1/

iea.org/commentaries/c…
Emissions from SUVs are estimated to have seen a slight increase of 0.5% in 2020, despite global emissions down ~7%.

"Despite the effects of the pandemic on overall car use, SUVs consumed more oil last year than they did in 2019"

2/
"Oil consumption from SUVs reached 5.5 million barrels per day in 2020"

"Remarkably, we estimate that the increase in the overall SUV fleet in 2020 cancelled out the declines in oil consumption by SUVs that resulted from Covid-related lockdown measures"

3/
Read 9 tweets
23 Dec 20
1. Oil & gas companies still expect the world to consume large quantities of oil & gas in 2050. That view would seem to put the oil giants in conflict with the IPCC.

𝐈𝐧 𝐟𝐚𝐜𝐭, 𝐭𝐡𝐞 𝐨𝐩𝐩𝐨𝐬𝐢𝐭𝐞 𝐢𝐬 𝐨𝐟𝐭𝐞𝐧 𝐭𝐫𝐮𝐞...

@bstorrow eenews.net/climatewire/st…
2. [O]il companies & the IPCC alike rely on a contentious strategy known as negative emissions — the practice of pulling carbon dioxide out of the atmosphere. In theory, NETs would buy the world a little more time to phase out the use of fossil fuels ...
3. "[N]one of these models are forecast machines" @DetlefvanVuuren

"It's just an element, a tool to explore different trajectories on the basis of the knowledge we have today & to see what ... might encounter."

Both critics & modelers agree such nuance is often lost
Read 20 tweets
22 Dec 20
1. Integrated Assessment Models (IAMs) often assume the same carbon prices in each region (left, orange dots): this is efficient but leads to large inequities (right).

More equitable distributions of carbon prices (left, blue dots) is less efficient.

doi.org/10.1038/s41586…
2. @NB_pik addresses this problem in a new paper: "The core finding of this research is the strongly nonlinear trade-off between cost-efficiency and sovereignty in achieving the long-term PA climate target in an equitable way."

Small changes to efficiency have big equity gains.
3. The gaps between uniform & differentiated carbon prices (first tweet) was modified to create the trade-off curve (previous tweet). This was done by applying an exponential function to adjust pairs of regional prices.

Is the "core finding" dependent on the "exponential"?
Read 10 tweets
22 Dec 20
Some updated carbon budgets from @CONSTRAIN_EU
→ 5 years left for 66% <1.5°C (HT @rtmcswee)

To what degree should we look at 66% <1.5°C?
* According to the 2018 #SR15, there are no scenarios 66% <1.5°C
* Huge gap between 50% 1.5°C & 66% 2°C (~1.7-1.8°C)

constrain-eu.org/publications/z…
We have become so obsessed with these arbitrary lines at 1.5°C & 2°C, but I think the more relevant point, is that there is a HUGE gap between 1.5°C & 2°C.

While 1.5°C might be too late, there is still lots to fight for.

Every 0.1°C is ~200GtCO₂!

cicero.oslo.no/no/posts/klima…
A slight technical point. 66% <1.5°C is probably around 1.3-1.4°C for 50%. We are at ~1.2°C today, so a 0.1°C increase or 200GtCO₂ is quite consistent with the remaining budget for 66% <1.5%...

[The 0.1°C ~ 200GtCO₂ is based on the TCRE, see link in previous tweet]
Read 4 tweets

Did Thread Reader help you today?

Support us! We are indie developers!


This site is made by just two indie developers on a laptop doing marketing, support and development! Read more about the story.

Become a Premium Member ($3/month or $30/year) and get exclusive features!

Become Premium

Too expensive? Make a small donation by buying us coffee ($5) or help with server cost ($10)

Donate via Paypal Become our Patreon

Thank you for your support!

Follow Us on Twitter!