How high will bond yields rise?
2.0%? 3.0%?
This isn't about yield curve control.
This is about when higher yields start to change the vector or direction of economic growth.
Some food for thought...
(Thread)
1/
2.0%? 3.0%?
This isn't about yield curve control.
This is about when higher yields start to change the vector or direction of economic growth.
Some food for thought...
(Thread)
1/
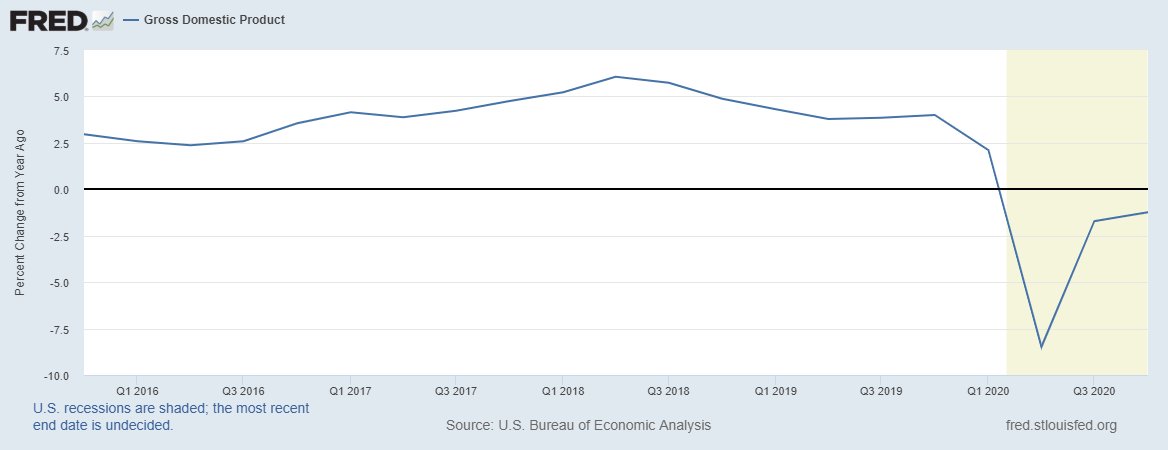
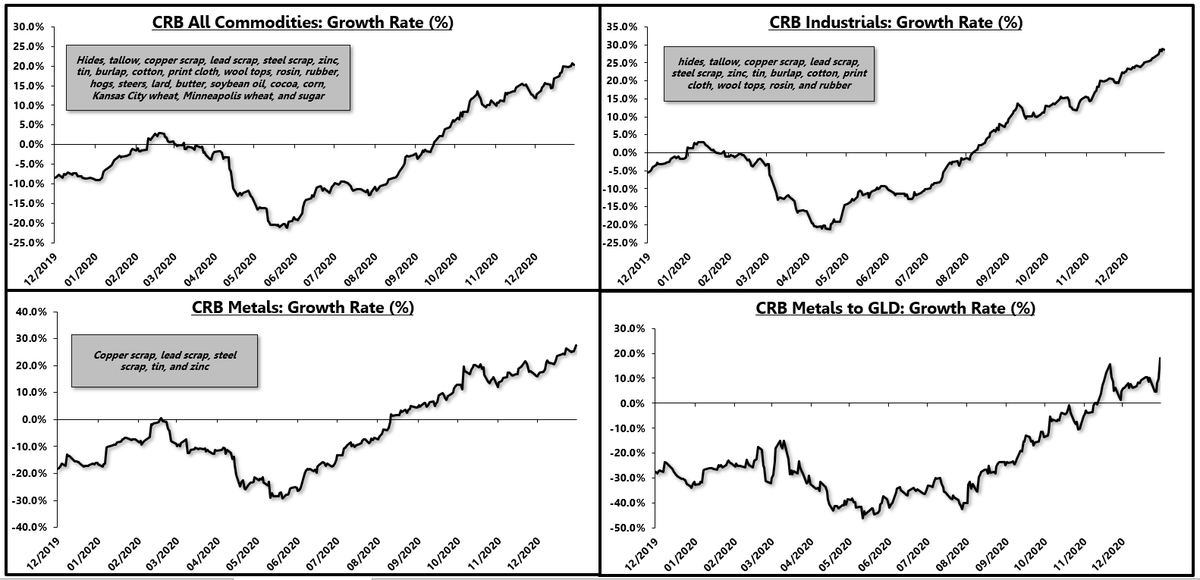
Over the summer (July) we started to note a rise in cyclical inflation indicators and noted it was prudent to hedge a rise in inflation.
My process separates long-term (secular) trends and multi-quarter/year (cyclical) trends.
We have a cyclical upturn on our hands.
2/
My process separates long-term (secular) trends and multi-quarter/year (cyclical) trends.
We have a cyclical upturn on our hands.
2/
This is not new or unique.
In fact, since 2010, we have had four major cyclical upturns in economic growth.
This is the fifth.
I don't use any technical analysis (not in my process).
However, we can use the last four cyclical upturns for clues.
3/
In fact, since 2010, we have had four major cyclical upturns in economic growth.
This is the fifth.
I don't use any technical analysis (not in my process).
However, we can use the last four cyclical upturns for clues.
3/
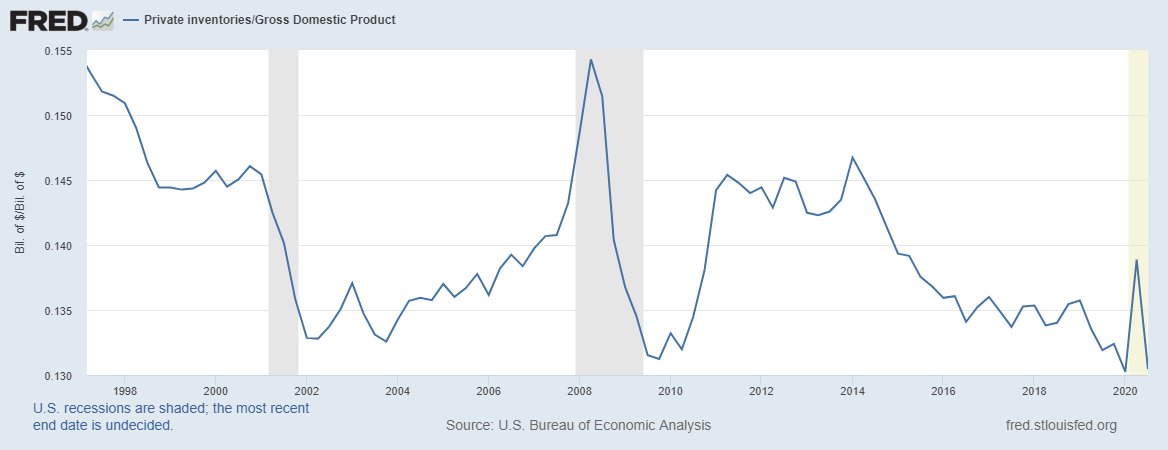
As the economy gets extremely overindebted, higher interest rates across anywhere on the curve starts to bite, and the impact happens quicker and quicker at higher levels of debt.
4/
4/
In the prior four cyclical upturns, 30YR bond yields rose:
125bps
151bps
101bps
135bps
AVG: ~128bps
5/
125bps
151bps
101bps
135bps
AVG: ~128bps
5/
In October, this reality was noted to clients when 30YR rates were 1.50%.
The implication was that an "average" cyclical upturn could see bond yields rise about 130bps from the low of 1.0%, placing 30YR rates around 2.30%.
6/
The implication was that an "average" cyclical upturn could see bond yields rise about 130bps from the low of 1.0%, placing 30YR rates around 2.30%.
6/
This is not a point estimate, nor a call for a reversal of bond yields exactly at 2.30%.
Rather, this is just some context around how much rates increased in past upturns and how in an indebted economy, 100-150bps really impacts growth.
7/
Rather, this is just some context around how much rates increased in past upturns and how in an indebted economy, 100-150bps really impacts growth.
7/
For short-term cyclical trends in growth/inflation, I use a host of leading indicators.
Those indicators are still pointing higher which means to me that this reflationary upturn is not dead yet.
8/
Those indicators are still pointing higher which means to me that this reflationary upturn is not dead yet.
8/
This upturn could be longer or shorter than average - we will have to watch the indicators.
But, a rise to 2.30% on the 30YR would place this rise in bond yields at just about "average" based on the last four cyclical upturns in economic growth.
9/
But, a rise to 2.30% on the 30YR would place this rise in bond yields at just about "average" based on the last four cyclical upturns in economic growth.
9/
We have more debt and more problems, so this rise could be less than average.
This is a post-recessionary rebound so the rise could be more than average.
10/
This is a post-recessionary rebound so the rise could be more than average.
10/
Most important is the cyclical direction of leading indicators (higher), but this is just some context around when rates may start to bite.
At 1.95% today on 30s, it is well within reason to see rates back at 2.30% should this upturn continue.
11/
At 1.95% today on 30s, it is well within reason to see rates back at 2.30% should this upturn continue.
11/
If the leads turn lower - bond yields should start coming down.
TLDR: we are in an upturn so the bias for rates is higher. Around 2.30% on 30s is when rates should start to slow economic growth based on the average of the last four cyclical upturns.
(end)
12/12
TLDR: we are in an upturn so the bias for rates is higher. Around 2.30% on 30s is when rates should start to slow economic growth based on the average of the last four cyclical upturns.
(end)
12/12
• • •
Missing some Tweet in this thread? You can try to
force a refresh