Today's COVID vaccination update:

- Total doses administered: 1,098,458
- New reported today *: 21,161
- Doses given per 100 people: 2.9
- Doses available per 100 people: 3.4

Source: covid19tracker.ca/vaccinationtra…

* Includes some weekend doses.
Canada's pace of vaccination:

Today's amount of 21,161 doses compares to an average of 17,567/day over the past week and 19,363/day the week prior.

- Daily pace required for two doses to 75% of Canadians by Sept 2021: 272,749
- At current pace, we reach 75% by Oct 2029
In total, Canada is up to 1.10 million doses administered, which represents 2.89% of Canada's population. This is out of a total of 1.3M vaccine doses available. Of those receiving at least one dose, at least 187k have received two (i.e., are fully vaccinated).
Turning to regions within Canada, here's the latest for each province and territory:

- Highest doses administered per 100 people: NW Terr. at 27.4
- Lowest: NS at 1.9
Each province has seen different rates of progress over time. Here are vaccination rates for provinces (aggregating Atlantic) to illustrate this.
Provinces administer, Feds distribute. Here's the fraction of doses delivered that have been administered. SK leading with 96.4% of delivered doses administered while NU has administered 48.8%.

Note: Shares >100% are due to squeezing 'extra' doses from vaccine vials.
How does Canada compare to others? Currently, Canada ranks 27 out of the 30 OECD countries with data reported.

Source: ourworldindata.org/covid-vaccinat…
Finally, a Canada/US comparison:

- Highest Prov: PE at 5.2 per 100 people
- Lowest Prov: NS at 1.9
- Highest State: AK at 20.6
- Lowest State: AL at 9.5

- Top CDN Terr: NT at 27.4
- Top US Terr: AS at 22.0

Sources: covid.cdc.gov/covid-data-tra… and covid19tracker.ca/vaccinationtra…
The above graphs are easy (and now entirely automated). Gathering the data is hard, and is thanks to Noah Little and other volunteers at @covid_canada (covid19tracker.ca/index.html).

If you like these updates, consider supporting their work at ko-fi.com/covid19tracker…

• • •

Missing some Tweet in this thread? You can try to force a refresh
 

Keep Current with Trevor Tombe

Trevor Tombe Profile picture

Stay in touch and get notified when new unrolls are available from this author!

Read all threads

This Thread may be Removed Anytime!

PDF

Twitter may remove this content at anytime! Save it as PDF for later use!

Try unrolling a thread yourself!

how to unroll video
  1. Follow @ThreadReaderApp to mention us!

  2. From a Twitter thread mention us with a keyword "unroll"
@threadreaderapp unroll

Practice here first or read more on our help page!

More from @trevortombe

10 Feb
Today's COVID vaccination update:

- Total doses administered: 1,124,229
- New reported today: 25,771
- Doses given per 100 people: 3.0
- Doses available per 100 people: 3.4

Source: covid19tracker.ca/vaccinationtra… Image
Canada's pace of vaccination:

Today's amount of 25,771 doses compares to an average of 19,432/day over the past week and 17,107/day the week prior.

- Daily pace required for two doses to 75% of Canadians by Sept 2021: 273,960
- At current pace, we reach 75% by Dec 2028 Image
In total, Canada is up to 1.12 million doses administered, which represents 2.96% of Canada's population. This is out of a total of 1.3M vaccine doses available. Of those receiving at least one dose, at least 204k have received two (i.e., are fully vaccinated). Image
Read 8 tweets
11 Dec 20
Today's data: national balance sheets for Q3!! 🥳 www150.statcan.gc.ca/n1/daily-quoti…

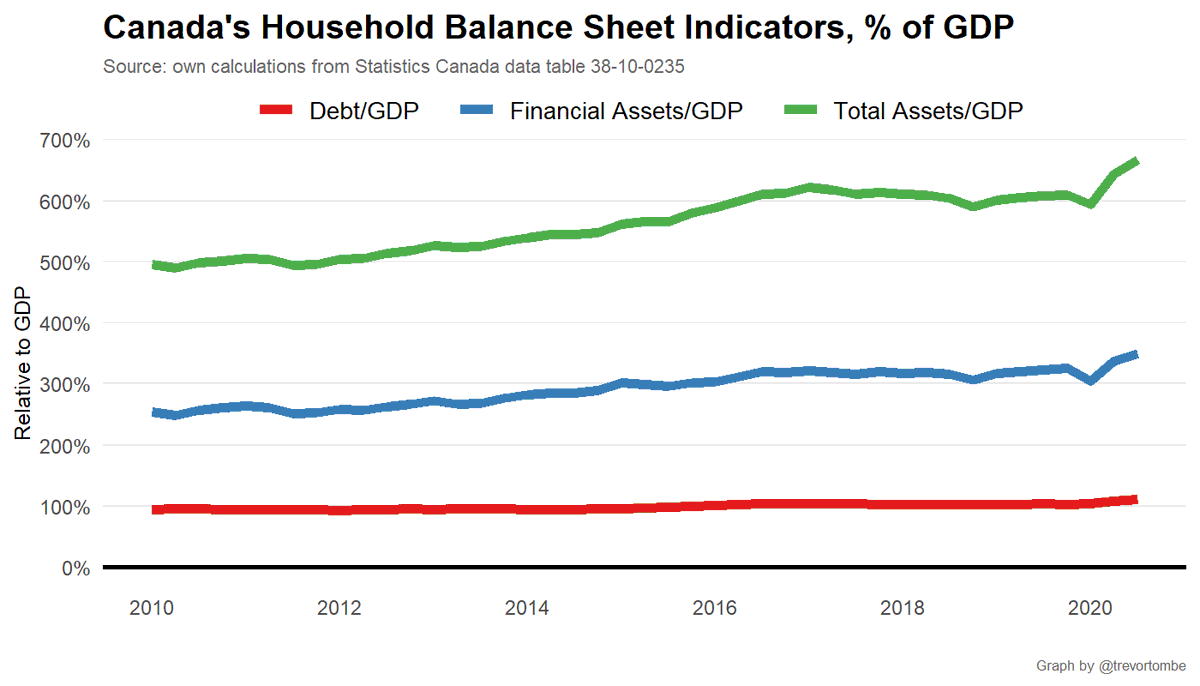
Household debt reaches all time high, but an under-reported statistic is that financial and total assets have also reached new highs. #cdnecon
This matters since many will see the riding debt as a sign over 'overleverage', but this isn't necessarily true. I'll paint a more optimistic picture here.

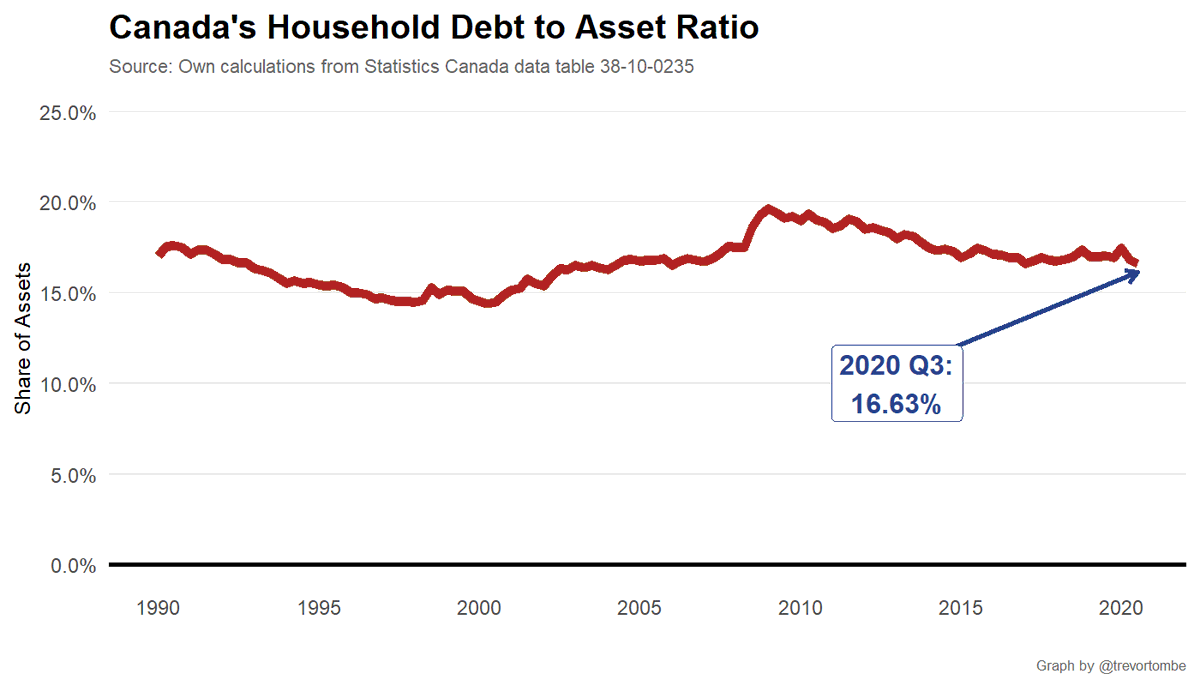
First, debt as a share of assets are very much in line with historical norms.
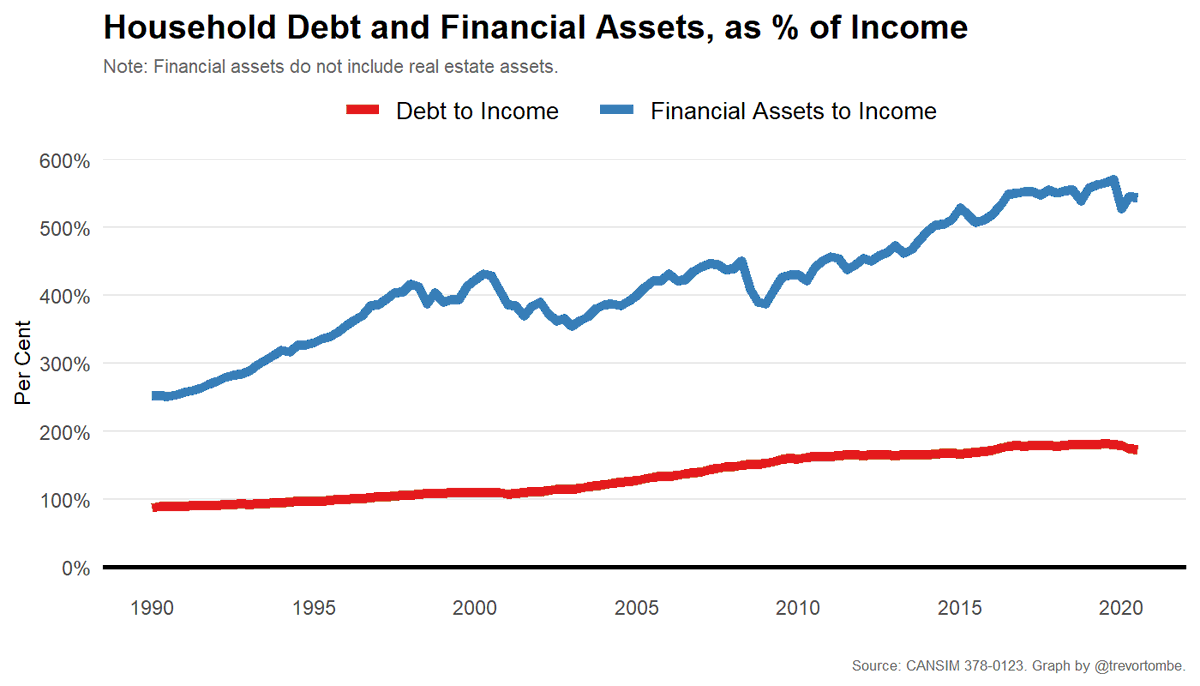
Second, the "household debt is 173% of income" headline is correct. But financial assets (which doesn't include homes, for example) is 544% of income!
Read 6 tweets
27 Aug 20
Big omissions in #ableg Fiscal Update: no recognition of our main fiscal challenge (reliance on resource revenues) and no indication of how we'll move forward.

As @RonKneebone so wisely put it: we have a substance abuse problem. Step 1 to overcoming it: admit we have a problem.
Here's a link to his paper: journalhosting.ucalgary.ca/index.php/sppp… (Read it!!)

Also, note this isn't a critique of current govt only. Failing to recognize this as a problem is an all-party challenge; former govt did it repeatedly as well.
I'll add that the province is going to need to consider revenue measures. No, not necessarily sales taxes. Gas taxes, a health levy (payroll tax), taking back CTax revenue, changing PIT rate, etc. Lots of options we should consider.
Read 5 tweets
23 Jul 20
When an organization uses "induced jobs" when talking about economic impacts, you know they overpaid for shoddy analysis.
Add up all the indirect effects, you'll get roughly two jobs for every job! And including induced gets really crazy. With not unreasonable assumptions, I can show you oil and gas accounts for infinity percent of Canada's economy.

INFINITY!!! ... must be an important sector.
Good resource: "uses and abuses" in IO analysis pc.gov.au/research/suppo…
Read 7 tweets
23 Jun 20
The $133 billion is the estimate of the gap between current assets and future pension commitments. It isn’t an “unfunded liability” in any sense that matters for the APP discussion. I’ll try to explain. #ableg
The CPP is funded by contributions of current workers and returns on investments. This is because of a sensible reform in the late-90s to ensure CPP is sustainable in the long run.
If we were to stop *ALL* contributions from workers but still pay out pension benefits that people have accumulated/earned then would current assets be enough? No. Does that mean CPP isn’t funded? No. Worker contributions make up the difference!
Read 11 tweets
17 Jun 20
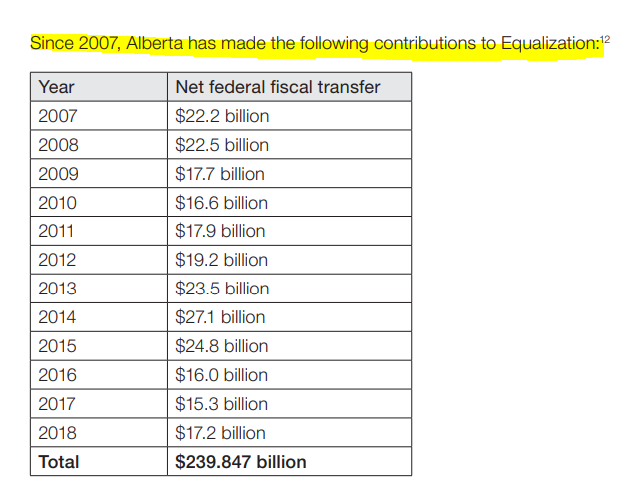
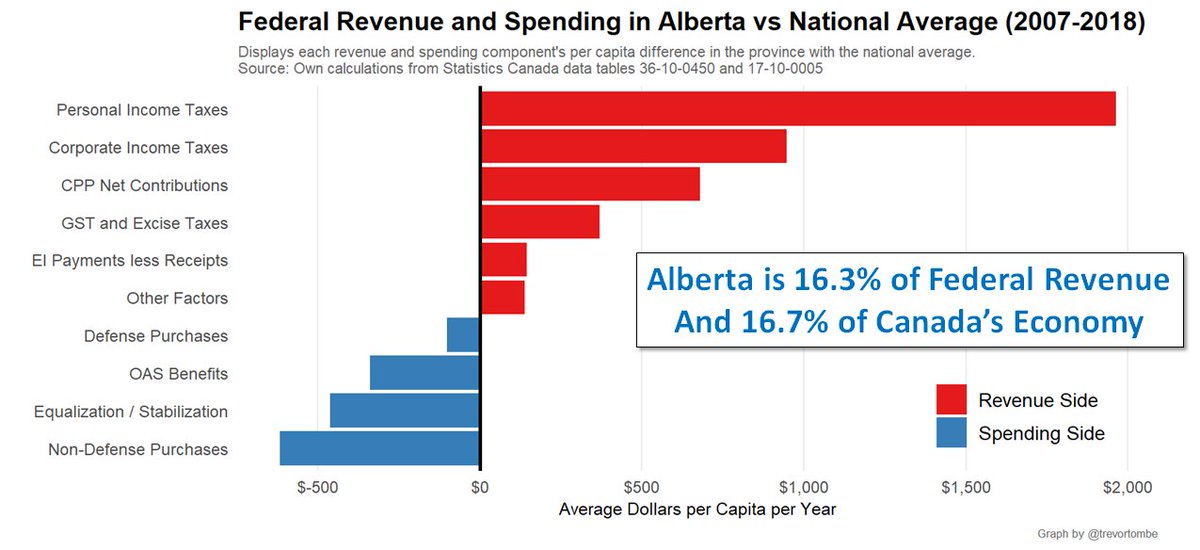
Recommendation 1 is to reform fiscal stabilization and hold an equalization referendum. Okay, fair enough to debate.

The analysis presented around Recommendation 1, however, is 100% false. It's mistakes like this that undermines the credibility of the panel's work. #ableg
It's not that these numbers are made up. Not at all. You can review them for yourself here: www150.statcan.gc.ca/t1/tbl1/en/tv.…

These represent the gaps between federal revenue from Albertans and spending in the province. It's not specifically about equalization. Not at all.
To learn more, I wrote about how to measure such fiscal transfers, and how to account for them by program, for the Canadian Tax Journal here: trevortombe.com/publication/tr…

TL;DR: Gap due to strong econ. And EQ accounts for as much 'transfer' out of Alberta as the GST. #FunFact
Read 9 tweets

Did Thread Reader help you today?

Support us! We are indie developers!


This site is made by just two indie developers on a laptop doing marketing, support and development! Read more about the story.

Become a Premium Member ($3/month or $30/year) and get exclusive features!

Become Premium

Too expensive? Make a small donation by buying us coffee ($5) or help with server cost ($10)

Donate via Paypal Become our Patreon

Thank you for your support!

Follow Us on Twitter!