Here are my heatmaps for cases, positivity, hospitalizations, and ICU admissions. This covers the period to 14 February 2021.
With commentary on a possible Covid vaccine effect in hospitalizations for 75-84 year olds.


With commentary on a possible Covid vaccine effect in hospitalizations for 75-84 year olds.


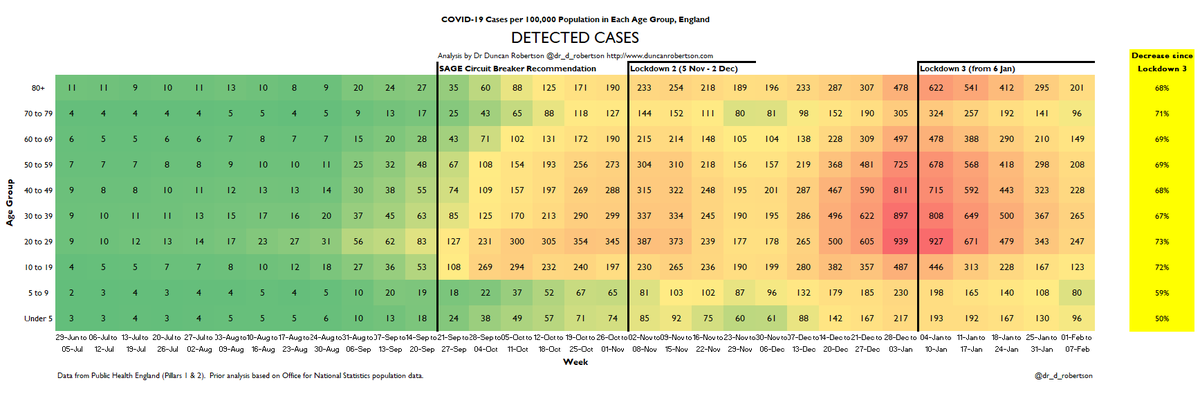
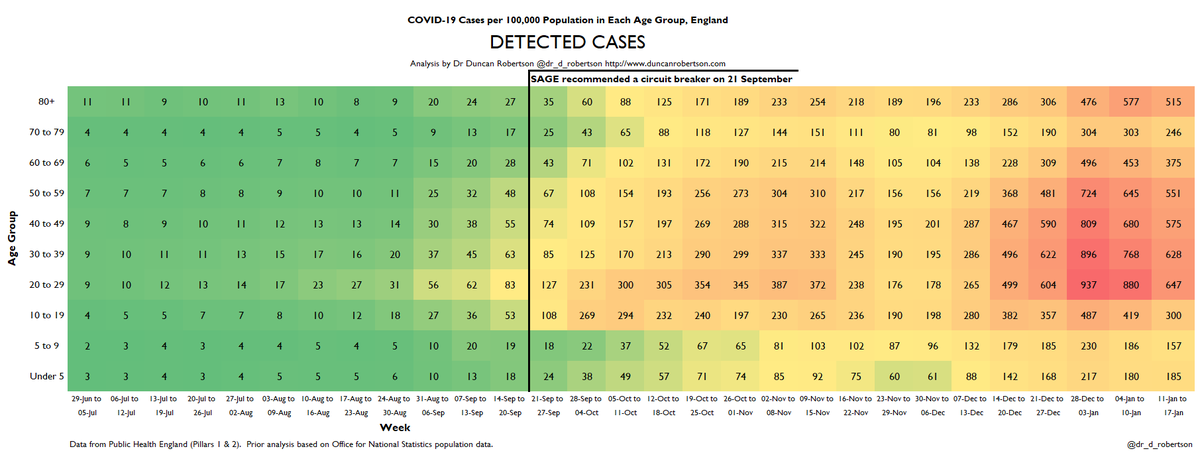
DETECTED CASES
Falling in all age groups. Falling fastest in 70+. Possible vaccine effect, but uncertain due to different testing regimes used.
Detected case rates over 100 per 100,000 in working age adults and over 80s.
Falling in all age groups. Falling fastest in 70+. Possible vaccine effect, but uncertain due to different testing regimes used.
Detected case rates over 100 per 100,000 in working age adults and over 80s.

TEST POSITIVITY - MALES
Still very high in 5-9 year olds and high in under-5s.
Note positivity figures are difficult to interpret due to a mixture of LFD and PCR tests.
This may in part explain higher positivity in children.
Still very high in 5-9 year olds and high in under-5s.
Note positivity figures are difficult to interpret due to a mixture of LFD and PCR tests.
This may in part explain higher positivity in children.

TEST POSITIVITY - FEMALES
Still very high in 70-79s and 80+ age groups.
Note positivity figures are difficult to interpret due to a mixture of LFD and PCR tests.
Marked difference in positivity profile to males.
Still very high in 70-79s and 80+ age groups.
Note positivity figures are difficult to interpret due to a mixture of LFD and PCR tests.
Marked difference in positivity profile to males.

HOSPITALIZATIONS
Approximately 22-24% decrease week on week for adults
apart from 75-84 year olds that show a 32% decrease.
This *could* be a tentative sign of a vaccine effect in this group (75-84 year olds).
Approximately 22-24% decrease week on week for adults
apart from 75-84 year olds that show a 32% decrease.
This *could* be a tentative sign of a vaccine effect in this group (75-84 year olds).

Another way of plotting this is to show the decrease on a log scale. If decreases are at the same *rate*, the slope should be the same.
You can see the dark blue line (75-84 year olds) is sloping downwards more than other adults. Hopefully this trend will continue next week.
You can see the dark blue line (75-84 year olds) is sloping downwards more than other adults. Hopefully this trend will continue next week.

ICU/HDU ADMISSIONS
Increase in over-85s (this may be due to less pressure than the peak).
Significant decrease in 45-64 year olds.
Numbers admitted for children admitted are small so increases/decreases should be treated with caution.
Increase in over-85s (this may be due to less pressure than the peak).
Significant decrease in 45-64 year olds.
Numbers admitted for children admitted are small so increases/decreases should be treated with caution.

Overall, an improving picture from a very high starting point. Numbers *in* hospital and *in* ICU remain extremely high.
Some hopeful signs of a vaccine effect in 75-84 year old hospital admissions. Hope this trend continues in the coming weeks, including for other age groups.

Some hopeful signs of a vaccine effect in 75-84 year old hospital admissions. Hope this trend continues in the coming weeks, including for other age groups.


• • •
Missing some Tweet in this thread? You can try to
force a refresh


