Today the Prime Minister will announce the roadmap out of lockdown. A short thread.
First of all, a reprise of previous attempts at coming out of lockdown. They haven't gone well.

So, what is the plan for release of lockdown this time? At the moment, this is what we have to go on.

We are told this is "cautious"
gov.uk/government/new…
Here are the four "tests" that are "currently being met"
Firstly, it is noticeable that numbers of cases itself will not be part of a test. We can expect the number of cases to increase, as the PM has indicated that R is 'likely' to exceed 1

So, a political decision is being made to expect increases in cases (and R greater than 1 implies exponential growth).

What happened when Lockdown 1 was relaxed was that cases started in young people and spread to older people (as predicted)

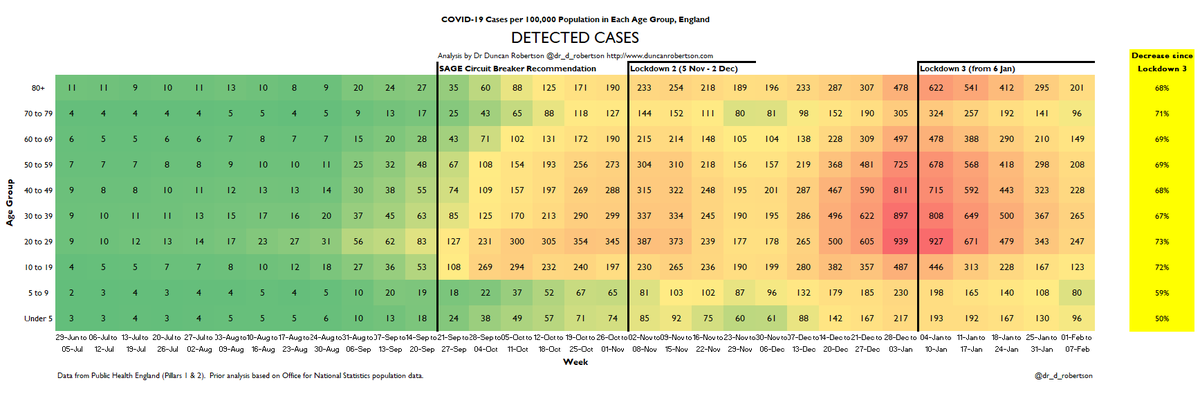
What we are seeing now are high numbers of cases. This number is falling due to lockdown.

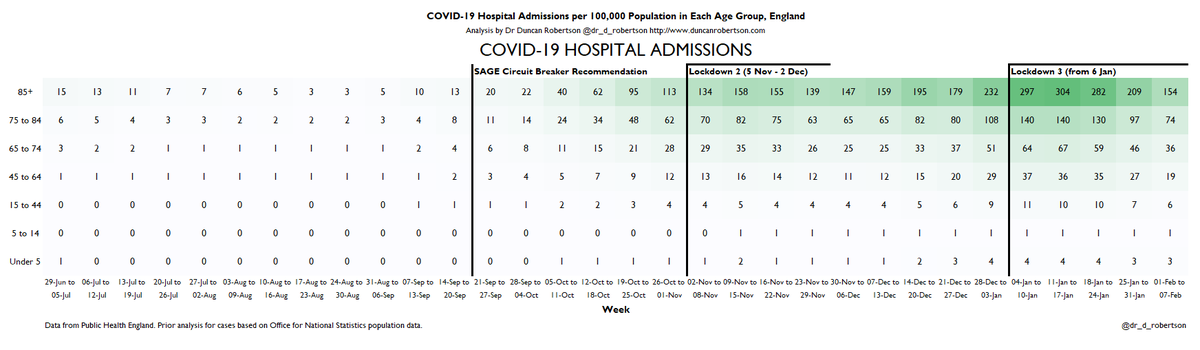
We are also seeing reduced hospitalizations.

However, there is still great pressure on hospitals. This is likey to reduce before 8 March.

The Governemnt *expects* an increase in cases.

The Government *hopes* that this will not translate into hospitalizations and deaths, and that the NHS will not be put under "unsustainable" pressure.
We can monitor the effect of school reopening in cases and hospitalization figures.

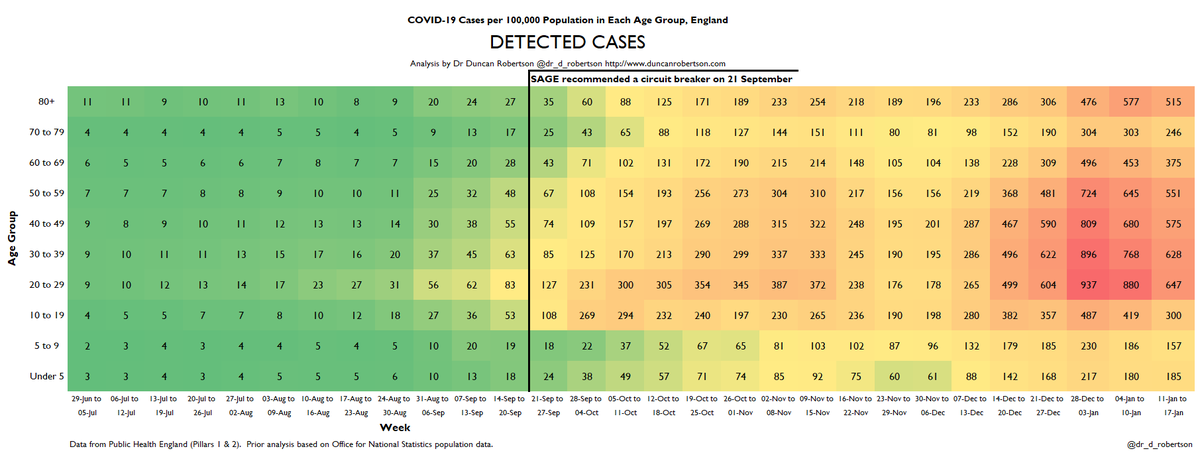
I publish heatmaps for these every week as my pinned tweet at twitter.com/Dr_D_Robertson with the current version here:
Going forward, the Government needs to adapt to the latest data.

There is a 5-week gap between all schools returning and the next phase of reopening. If the Government does not heed advice before embarking on the second phase of reopening, it risks a further, fourth, lockdown.
Here is my interview this morning with BBC local radio discussing the plans for release from lockdown 3

• • •

Missing some Tweet in this thread? You can try to force a refresh
 

Keep Current with Dr Duncan Robertson

Dr Duncan Robertson Profile picture

Stay in touch and get notified when new unrolls are available from this author!

Read all threads

This Thread may be Removed Anytime!

PDF

Twitter may remove this content at anytime! Save it as PDF for later use!

Try unrolling a thread yourself!

how to unroll video
  1. Follow @ThreadReaderApp to mention us!

  2. From a Twitter thread mention us with a keyword "unroll"
@threadreaderapp unroll

Practice here first or read more on our help page!

More from @Dr_D_Robertson

22 Feb
The Government's roadmap for reopening has been published.

I will add commentary as I read through.

From first glance, there are no numbers for thresholds, which does in some way question the notion of 'data not dates'.

There are however a lot of dates in the document.
The roadmap itself is only 15 pages long.
It sets out 'principles'
- whole of England rather than regional response
- "led by data not dates" (see above)
- five weeks between steps - 'no earlier than'
- face-to-face education a priority
Read 17 tweets
21 Feb
On the face of it, this does seem to be more weighted to dates rather than data.

It will be interesting to see if *any* quantitative thresholds for cases, hospitalizations, or pressure on hospitals are set out on Monday, or whether the only thing that are set are dates.
It is obviously a risk, I'd reports are correct, to send all school children back on the same date. One critical thing missing is the ability to adapt. If R exceeds 1 and hospitalizations increase as a result of this, all that can be done is to close face to face...
schooling with the effect this will have on children's continuity of education. It would be prudent to send *some* children back and see the effect before committing all children.

Remember, it is not just the interactions between children (which *could* be mitigated...
Read 6 tweets
18 Feb
Here are my heatmaps for cases, positivity, hospitalizations, and ICU admissions. This covers the period to 14 February 2021.

With commentary on a possible Covid vaccine effect in hospitalizations for 75-84 year olds. ImageImageImageImage
DETECTED CASES

Falling in all age groups. Falling fastest in 70+. Possible vaccine effect, but uncertain due to different testing regimes used.

Detected case rates over 100 per 100,000 in working age adults and over 80s. Image
Here is the monochrome version of the chart above. Image
Read 10 tweets
12 Feb
Are we starting to see a clear vaccine effect in detected cases and hospitalizations?

In short, not yet.

A short thread.
Hopitalizations falling 46-49% in adult age groups over the last 5 weeks.
Detected cases falling 68-73% in adult age groups over the last 5 weeks.
Read 10 tweets
11 Feb
Here are the latest heatmaps for cases, positivity, hospitalizations, and ICU admissions. This covers the period to 7 February 2021.

All are very high, but thankfully all are decreasing due to Lockdown 3.
DETECTED CASES

Decreasing in all age groups, still very high.
POSITIVITY

Decreasing in all age groups. Decreasing slowest in children.

Note that increased use of lateral flow device testing may make comparisons more difficult.
Read 9 tweets
24 Jan
We risk creating a legal fiction that workplaces are safe when they are not.

A short thread on the DVLA outbreak, and Government policy.
In order to encourage people back to work after the first wave (presumably under political pressure), the civil service set targets for 4 out of 5 civil servants to return to their workplaces

news.sky.com/story/coronavi…
This was when we were seeing increases in case rates in younger people and was couple of weeks before SAGE went on to recommend a circuit breaker.
Read 11 tweets

Did Thread Reader help you today?

Support us! We are indie developers!


This site is made by just two indie developers on a laptop doing marketing, support and development! Read more about the story.

Become a Premium Member ($3/month or $30/year) and get exclusive features!

Become Premium

Too expensive? Make a small donation by buying us coffee ($5) or help with server cost ($10)

Donate via Paypal Become our Patreon

Thank you for your support!

Follow Us on Twitter!