💉VACCINE DATA UPDATE (March 3)💉

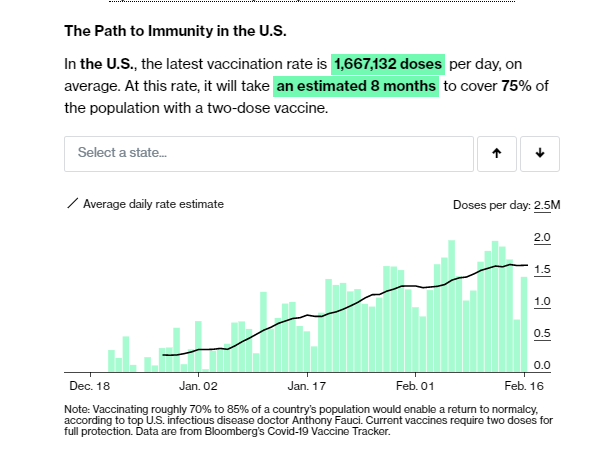
⭐️Our U.S. 7-day average is now 2.01M doses/day, the first time above 2M. This appears to be driven by a combo of winter-storm make-up doses + increasing supply.

📊1.91M doses today; 7-day 2.01M
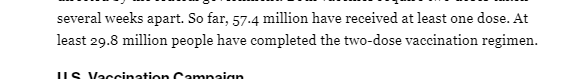
🇺🇸US: 80.5M doses total

bloomberg.com/graphics/covid… Image
If there's a significant pull-back after the storm make-up bump, this could slip back down. But between J&J doses going into arms this week + rising shipments of about 15M doses/week, that seems unlikely/short-lived.

2M+ averages may be the new normal.

bloomberg.com/graphics/covid…
👋Our full graphic, all of our data/tables/maps/really cool charts are available here:

bloomberg.com/graphics/covid…
You may post your dunk gifs in the replies.

• • •

Missing some Tweet in this thread? You can try to force a refresh
 

Keep Current with Drew Armstrong

Drew Armstrong Profile picture

Stay in touch and get notified when new unrolls are available from this author!

Read all threads

This Thread may be Removed Anytime!

PDF

Twitter may remove this content at anytime! Save it as PDF for later use!

Try unrolling a thread yourself!

how to unroll video
  1. Follow @ThreadReaderApp to mention us!

  2. From a Twitter thread mention us with a keyword "unroll"
@threadreaderapp unroll

Practice here first or read more on our help page!

More from @ArmstrongDrew

6 Mar
💉VACCINE DATA UPDATE (March 6)💉

⭐️One-day record, almost 3M doses reported in the U.S. Mass vaccination sites like FEMA-run centers + stadiums may be boosting numbers.

📊2.9M doses today; 7-day avg=2.16M/day
🇺🇸US: 87.9M doses total

bloomberg.com/graphics/covid… Image
We'll be adding more granular data on J&J doses as we get it. We are hoping that will be on Monday.
For those looking for how many *people* have gotten first/second doses, that information updates with every mini-update here, just above the table: Image
Read 6 tweets
21 Feb
💉VACCINE DATA UPDATE (Feb. 21)💉

📊1.8M doses today; 7-day average=1.33M/day
🇺🇸US: 63.1M doses total

⚠️Please note our methodological change in the post below! The U.S. rate weirdness is b/c of a significant data switch.
bloomberg.com/graphics/covid…
Please read this post on our methodology change, and some very significant changes to how CDC is reporting data:

bloomberg.com/news/live-blog…
Also, uh, this happened and we still don't know what it is...

Read 4 tweets
21 Feb
💉VACCINE DATA (methodology) UPDATE⚠️

We have our usual update coming later tonight, and I'll thread it here. But in the meantime we have a very important methodology update about how we get data + count doses.

bloomberg.com/news/live-blog…
Short version: CDC made major changes in how they attribute doses to states, in a way that makes their data non-comparable with state-produced data. Unless something changed, we will be using CDC data for the U.S. going forward. Read the details here:

bloomberg.com/news/live-blog…
There are upsides and downsides to this change.

Upside: It places Defense Dept. vaccinations in the place where people reside. That's important -- the 1918 flu is thought to have started in a military base in Kansas. These federal categories aren't abstract.
Read 9 tweets
20 Feb
💉VACCINE DATA UPDATE (Feb. 19)💉

📊1.4M doses today; 7-day avg=1.49M/day
🇺🇸US: 60.5M doses total

❄️⚡️We continue to see BIG impact from the storms.

🧵below on a *major* methodological change at CDC that affects our totals tonight

bloomberg.com/graphics/covid… Image
⚠️First, CDC's method change (this is important)

1/ As of this afternoon, CDC is assigning doses given to people in federal entities TO the states where they reside. This significantly affects the CDC's state totals in a way that makes them harder to compare to state dashboards
2/ This amounts to about 3 million doses. This makes it much harder for us to compare what states report to what CDC reports, which is a big part of our model. (Federal entity numbers are not typically included in state-reported vaccine tallies.)
Read 10 tweets
17 Feb
💉Along with how many vaccines are getting administered, a major question is WHO is getting vaccinated.

Today our team launched a demographics vertical, looking at vaccine breakdowns by race/ethnicity in various states. It's awesome--check it out

bloomberg.com/graphics/covid…
You can see how various groups are getting vaccinated vs their populations. Black and Hispanic populations are being vaccinated below their population shares, while some groups are getting vaccinated above.

bloomberg.com/graphics/covid…
Because many states don't report the data, on don't have great data completeness, we've integrated state-by-state data quality rankings -- you can explore them here:
bloomberg.com/graphics/covid…
Read 6 tweets
16 Feb
💉VACCINE DATA UPDATE (Feb. 16)💉

📈1.5M doses today; 7-day avg=1.67M/day
🇺🇸US: 56.1M doses total
👪40.2M people w/ at least 1 dose, 15.6M completed vaccination

❄️Cold in Texas/elsewhere likely pushed daily rate down
⚠️CDC updated today after not yday

bloomberg.com/graphics/covid…
New cases in the U.S. continue to fall after the holiday surge. This chart plots total vaccinations vs confirmed cases. More vaccine = more impact on driving down new cases. The leveling off there is (probably mostly) from post-holiday decline.

bloomberg.com/news/articles/…
Our full graphic and data, including our international maps and graphics, are available here.

bloomberg.com/graphics/covid…
Read 4 tweets

Did Thread Reader help you today?

Support us! We are indie developers!


This site is made by just two indie developers on a laptop doing marketing, support and development! Read more about the story.

Become a Premium Member ($3/month or $30/year) and get exclusive features!

Become Premium

Too expensive? Make a small donation by buying us coffee ($5) or help with server cost ($10)

Donate via Paypal Become our Patreon

Thank you for your support!

Follow Us on Twitter!