💉VACCINE DATA UPDATE (March 6)💉
⭐️One-day record, almost 3M doses reported in the U.S. Mass vaccination sites like FEMA-run centers + stadiums may be boosting numbers.
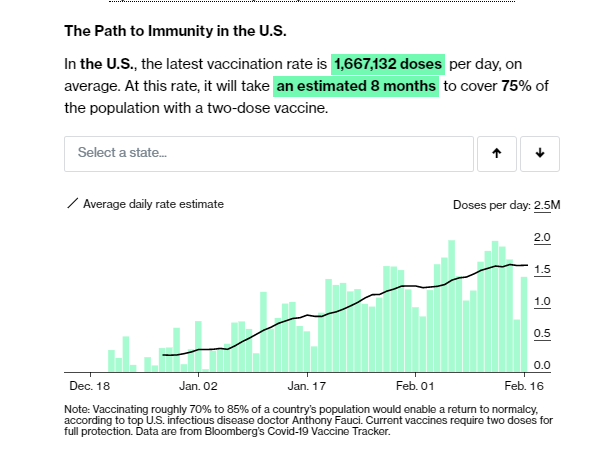
📊2.9M doses today; 7-day avg=2.16M/day
🇺🇸US: 87.9M doses total
bloomberg.com/graphics/covid…
⭐️One-day record, almost 3M doses reported in the U.S. Mass vaccination sites like FEMA-run centers + stadiums may be boosting numbers.
📊2.9M doses today; 7-day avg=2.16M/day
🇺🇸US: 87.9M doses total
bloomberg.com/graphics/covid…

We'll be adding more granular data on J&J doses as we get it. We are hoping that will be on Monday.
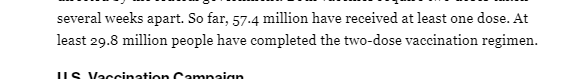
For those looking for how many *people* have gotten first/second doses, that information updates with every mini-update here, just above the table:
For those new to the tracker + wondering about the pace of our updates: 1) We do a US-wide update as soon as we have data from CDC; 2) We do a global sweep in the afternoons that takes a few hours; 3) NYC gets in there via the global update.
We'll have some more to say soon about the CDC data + process, how they report one-shot doses, and some thoughts about the comparability of that data with state data.
Typically, U.S. updates happen early afternoon. Rarely but sometimes....they take much longer.
I tend to focus these tweets on the U.S. toplines. The full graphic contains all of our global data, and many tools and tables that are fun to play with.
@johnfraher + @tsrandall are excellent follows for global data and additional analysis of the vaccine numbers.
@johnfraher + @tsrandall are excellent follows for global data and additional analysis of the vaccine numbers.
• • •
Missing some Tweet in this thread? You can try to
force a refresh