PHE COVID surveillance report out covering 22nd-28th Feb, plus also today's REACT data. 🧵
tl,dr. Things are getting better but inequalities continue to persist.
gov.uk/government/sta…
tl,dr. Things are getting better but inequalities continue to persist.
gov.uk/government/sta…

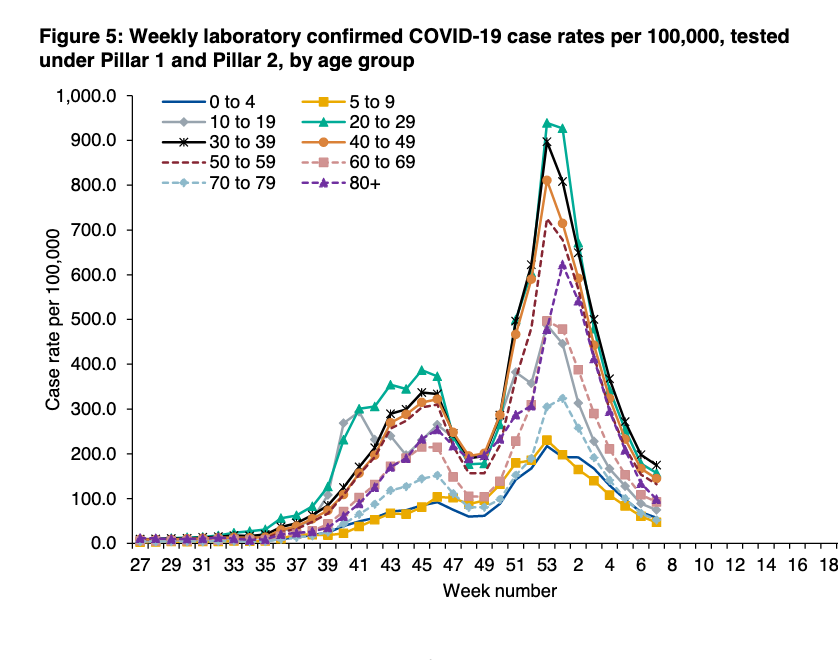
Case rates have continued to drop in all ages.
And check out how rates in 80+y/o were tracking with those aged 20-60yrs
but over the last few weeks the rate of decline has accelerated to track more closely with those aged 60-80yrs.
And check out how rates in 80+y/o were tracking with those aged 20-60yrs
but over the last few weeks the rate of decline has accelerated to track more closely with those aged 60-80yrs.

After positivity went a bit wild last week (half term and therefore far fewer LFDs being done) reassuring it's back to similar trends to the week before.
Having said this, pillar 2 positivity is really hard to interpret now as includes LFDs and PCR.
Having said this, pillar 2 positivity is really hard to interpret now as includes LFDs and PCR.

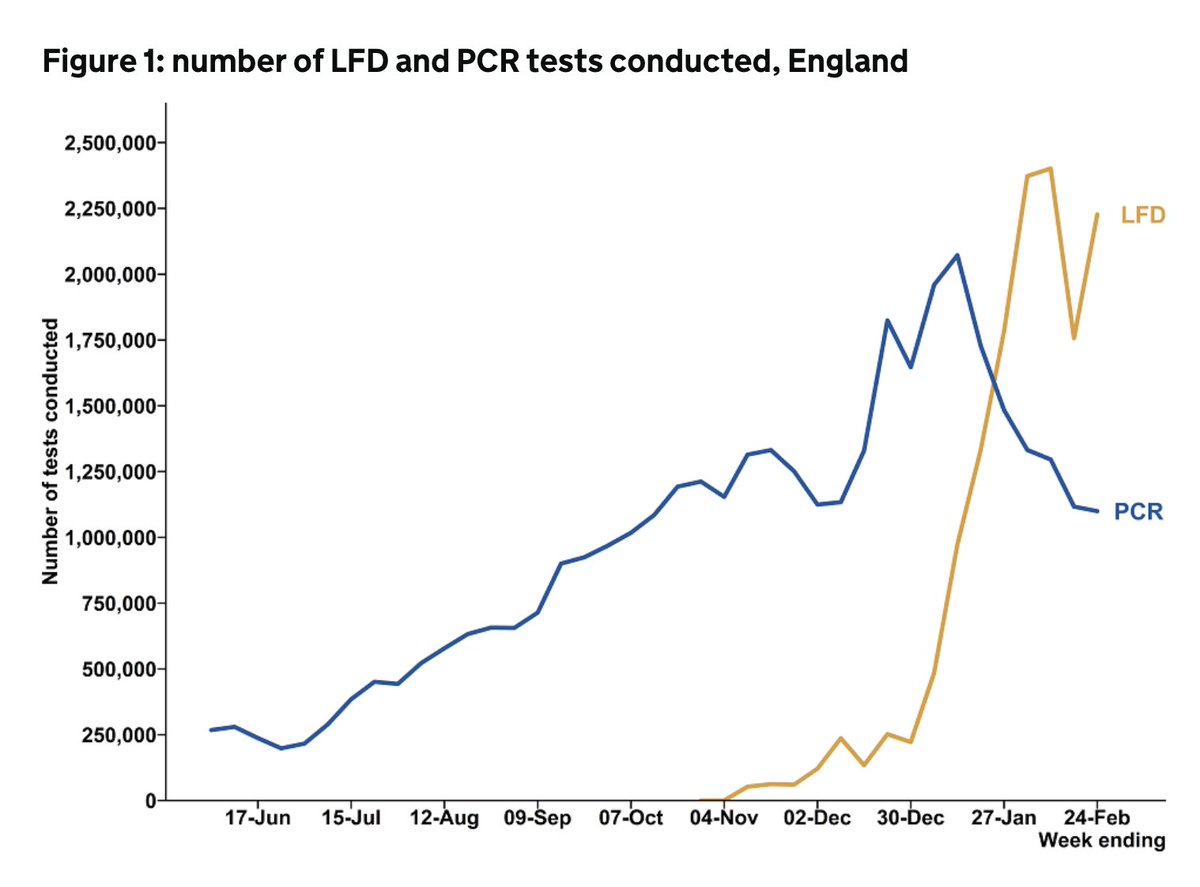
PHE do publish an overall chart of PCR and LFD positivity.
Can see the big drop in LFD use for half term week and how overall LFD positivity is just 0.3% compared with 3.6% for PCR tests
Can see the big drop in LFD use for half term week and how overall LFD positivity is just 0.3% compared with 3.6% for PCR tests

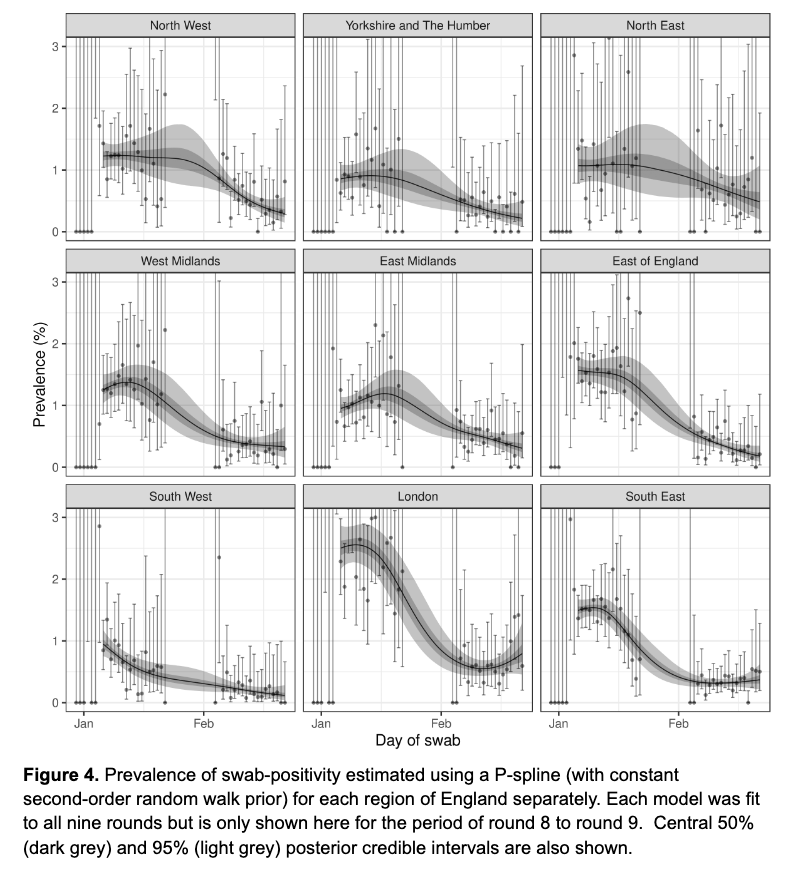
Case rates dropping across regions, with clear lower rates in the south (SE, SW, East Mid, London) compared with the north.
London picture here is different to today's REACT study prevalence data, so worth interpreting how PHE data might relate to pop'n prevalence with caution.
London picture here is different to today's REACT study prevalence data, so worth interpreting how PHE data might relate to pop'n prevalence with caution.


The deprivation data between REACT and PHE does correlate, however.
People from more deprived areas persistently have higher infection rates.
People from more deprived areas persistently have higher infection rates.


For brief summary of today's REACT study findings, see here
https://twitter.com/ADMBriggs/status/1367474158716747783?s=20
The differences in cases rates by ethnicity persist but are less striking that at the January peak.
REACT shows still important differences in infection prevalence (and note - REACT is a representative population sample whereas PHE is only people who choose to get tested)
REACT shows still important differences in infection prevalence (and note - REACT is a representative population sample whereas PHE is only people who choose to get tested)


Despite drop in cases among over 70y/o, there's no big change in number of outbreaks reported in care homes.
It may be that these result in less hospitalisations/deaths than before (see later in thread) but it's still v important to vaccinate any unvaccinated staff/residents
It may be that these result in less hospitalisations/deaths than before (see later in thread) but it's still v important to vaccinate any unvaccinated staff/residents

Reported outbreaks in hospitals and workplaces remain unchanged.


And there's a particularly striking fall in outbreaks reported to PHE in educational settings. Not sure why.

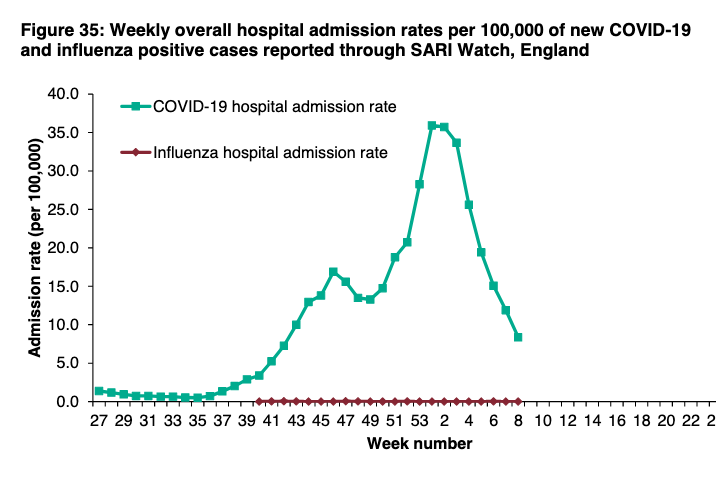
When it comes to hospital admission rates, these are still falling relatively quickly for all ages, and especially 75+.

Also falling in all regions although there's a lag in West Mids.

However, despite care rates falling, the total number in hospital is still only just dipped below the November peak.

For ICU, despite younger people generally being those admitted and much of that population unlikely yet to be vaccinated, the fall in admission rates is really encouraging.

Falling as fast among 45-64y/o as 65-74y/o.

It's also falling across all regions, although notably not as quickly in East Mids and Yorkshire and Humber

And whilst admission rates are falling, ICU bed use is still considerably higher than Nov peak.

Finally, deaths rates still plummeting and excess mortality suggests we may be getting closer to what would be expected this time of the year
(some caution - there is always a delay in the most recent death registrations and this year there's absolutely no flu)
(some caution - there is always a delay in the most recent death registrations and this year there's absolutely no flu)


All in all, it's a relatively good picture as we get closer to opening schools, although there are still a lot of people in hospital.
And until we meaningfully engage in the underlying structural drivers, inequalities will persist.
And until we meaningfully engage in the underlying structural drivers, inequalities will persist.
https://twitter.com/ADMBriggs/status/1367234736016547843?s=20
PHE surveil rpt☝️ @felly500 @deb_cohen @martinmckee @carolecadwalla @mgtmccartney @ADPHUK @Jeanelleuk
@fascinatorfun @profchrisham @petermbenglish @HPIAndyCowper @Davewwest @HSJEditor @KateAlvanley
@IndependentSage @nedwards_1 @SamanthaJonesUK @ewanbirney @FurberA @Dr_D_Robertson
@fascinatorfun @profchrisham @petermbenglish @HPIAndyCowper @Davewwest @HSJEditor @KateAlvanley
@IndependentSage @nedwards_1 @SamanthaJonesUK @ewanbirney @FurberA @Dr_D_Robertson
• • •
Missing some Tweet in this thread? You can try to
force a refresh