This week's PHE COVID surveillance report now out.
Most recent week covers 8th-14th Feb.
tl,dr: Things continue to improve but NHS bed/ICU situation has only *just* dipped below April peak. And some potentially worrying regional variation.
gov.uk/government/sta…
Most recent week covers 8th-14th Feb.
tl,dr: Things continue to improve but NHS bed/ICU situation has only *just* dipped below April peak. And some potentially worrying regional variation.
gov.uk/government/sta…

Case rates and positivity falling relatively fast. And across all ages.

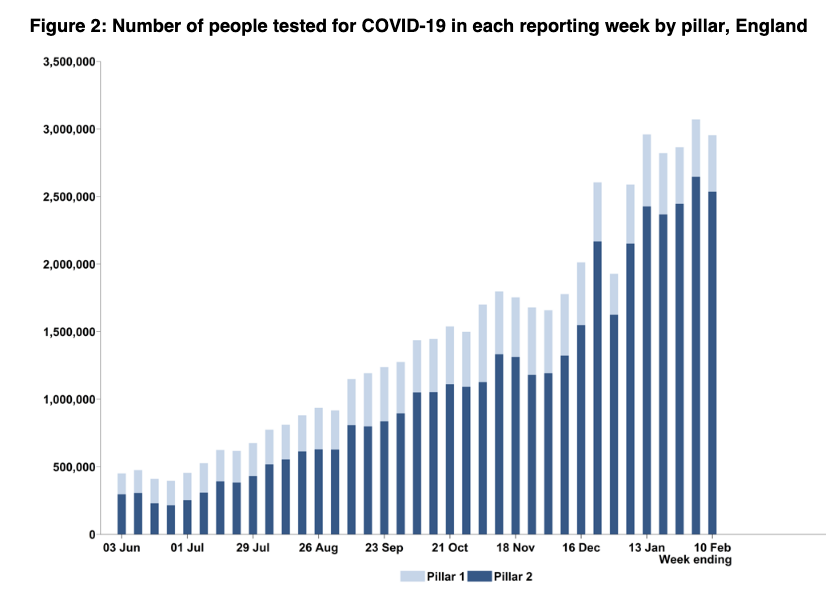
Percentage of tests positive also falling, but this pillar 2 (community testing) graph has also been causing people some concern re young school children and returning to school - despite reported case rates being the lowest of all age gps.

May be many reasons- higher symptom threshold for tests, that they don't do LFDs this age (pillar 2 includes PCR and LFD tests), or possibly more COVID that's not seen in case rates as fewer kids getting tested.
But neither REACT nor ONS data suggest this age is a major outlier.
But neither REACT nor ONS data suggest this age is a major outlier.


and as LFD use rises and PCR use falls, the positivity rate between PCR testing for people with symptoms is 5.7% compared with 0.4% for rapid lateral flow device use among asymptomatic people.
So as more LFDs are done, overall pillar 2 positivity will fall further.
So as more LFDs are done, overall pillar 2 positivity will fall further.

Case rates falling in all regions.
But note that Yorkshire and Humber, and the NE are being crossed by other regions with faster falls in case rates.
This is supported by today's slightly concerning REACT data that case rates in these regions aren't declining like elsewhere.
But note that Yorkshire and Humber, and the NE are being crossed by other regions with faster falls in case rates.
This is supported by today's slightly concerning REACT data that case rates in these regions aren't declining like elsewhere.


As case rates fall, differences by ethnicity remain but are becoming less pronounced (again seen in REACT)


But by deprivation group they are as evident as ever.


In terms of incidents/outbreaks reported to PHE health protection teams, really great to see another significant fall in the numbers for care homes.
And no change in the already very low numbers reported from hospitals.
And no change in the already very low numbers reported from hospitals.


Slight drop in the number of incidents/outbreaks reported in education settings (and mainly these are in nursery settings)

And no change for workplaces.

Admission rates continue to fall fairly steeply in all ages.


The regional data are more mixed. Whilst it's falling everywhere, Yorkshire and Humber and NE stand out for being overtaken by other regions.

And alongside the declines, really important to note that the number of COVID patients in hospital has only just dipped below the *peak* of the first wave in April.

ICU admission rates also falling, but some differences across ages as people move into available beds.


Also differences across regions, with increases in admission rates in NE and West Mids.

And again - worth putting the number of people in ITU with COVID into perspective from the April peak.
As @ChrisCEOHopson said yesterday, as of week to 7th Feb ICUs were operating at 170% of this time last yr.
As @ChrisCEOHopson said yesterday, as of week to 7th Feb ICUs were operating at 170% of this time last yr.

See @ChrisCEOHopson's excellent thread about how the current NHS situation compares with the first wave.
https://twitter.com/ChrisCEOHopson/status/1362066427289681920?s=20
Deaths rates continue to fall, as does excess mortality - although overall that still remains high.


Flu rates remain almost negligible, and the vaccine programme continues to race along.


So as with last week, it's looking better but the NHS is still some way from being anywhere near normal for this time of the year.
And great to see things continuing to improve in care homes.
And great to see things continuing to improve in care homes.
PHE surveil rpt @felly500 @deb_cohen @martinmckee @carolecadwalla @mgtmccartney @ADPHUK @Jeanelleuk
@fascinatorfun @profchrisham @petermbenglish @HPIAndyCowper @Davewwest @HSJEditor @KateAlvanley
@IndependentSage @nedwards_1 @SamanthaJonesUK @ewanbirney @FurberA @Dr_D_Robertson
@fascinatorfun @profchrisham @petermbenglish @HPIAndyCowper @Davewwest @HSJEditor @KateAlvanley
@IndependentSage @nedwards_1 @SamanthaJonesUK @ewanbirney @FurberA @Dr_D_Robertson
And if useful, this week's T&T thread here:
And REACT summary here:
https://twitter.com/ADMBriggs/status/1362392515933069315?s=20
And REACT summary here:
https://twitter.com/ADMBriggs/status/1362349211551993858?s=20
• • •
Missing some Tweet in this thread? You can try to
force a refresh