This week's T&T update. Covers 11th-17th Feb.
Tl,dr
testing, cases, and contacts all down
performance steady
and a critical need to tackle inequalities.
gov.uk/government/pub…
Tl,dr
testing, cases, and contacts all down
performance steady
and a critical need to tackle inequalities.
gov.uk/government/pub…

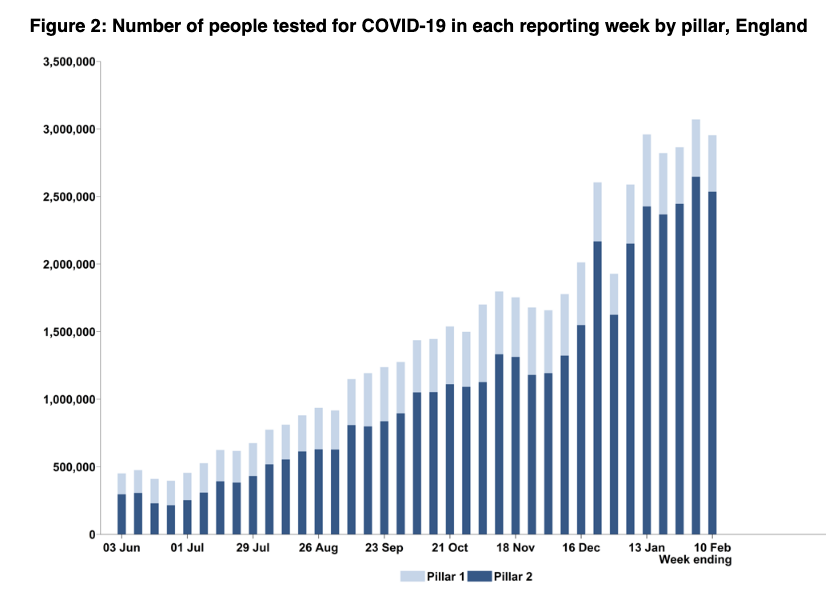
First decent fall in number of people being tested this week (not including Christmas/NY).
Down 14% to 2.6m.
Down 14% to 2.6m.

Lateral flow device (LFD) use for people w/o symptoms has fallen for the first time as well as PCR.
Part this will be because this week covers the first few days of the school half term (15-19 Feb) and much of LFD use is in schools.
Would expect this to bounce up again next wk
Part this will be because this week covers the first few days of the school half term (15-19 Feb) and much of LFD use is in schools.
Would expect this to bounce up again next wk

Some variation in use by region.
This will change as asymptomatic testing is rolled out and more people are back at school/college/work.
Current LFD use rates lowest in London and highest in SW. Will be following this closely over coming weeks to check for any emerging inequals
This will change as asymptomatic testing is rolled out and more people are back at school/college/work.
Current LFD use rates lowest in London and highest in SW. Will be following this closely over coming weeks to check for any emerging inequals


PCR test turnaround time is good, with 87% of in person PCR test results received within 24hrs of taking the test.
For home/satellite tests, it's 83% within 48hrs
For home/satellite tests, it's 83% within 48hrs


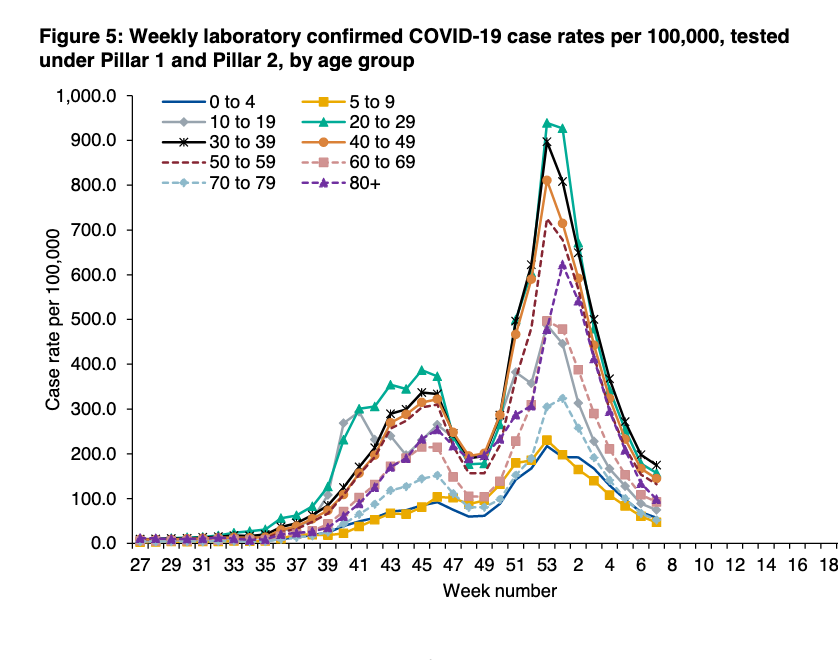
Case numbers down 21% this week on the week before, with 83k cases handled by T&T

Of these, 73,976 (88%) were reached. This percentage has been steadily around 86-89% since Nov last year.


On cases reached, 75% - 54,331 cases - provided details of close contacts.

Between them, identifying 146,757 contacts, or 2 contacts per case.

3,377 cases and 2,715 contacts were managed by local PHE health protection teams. These are more complex or high risk cases with a median 15 contacts per case.
The remaining 69,599 cases and 144,042 contacts were managed by T&T along with local authority contact tracing systems that take on cases the national team can't reach within 24hrs (mean 2.1 contacts per case, median 2).
The proportion of contacts reached by the national team has been pretty constant at around 93% since start of Dec.

85% of contacts at the moment are from the same household as the case.
So the overall figure of 93% is made up of 97% reached for household contacts (generally told by the case to isolate rather than phoned by T&T), and 71% for non household contacts.
So the overall figure of 93% is made up of 97% reached for household contacts (generally told by the case to isolate rather than phoned by T&T), and 71% for non household contacts.

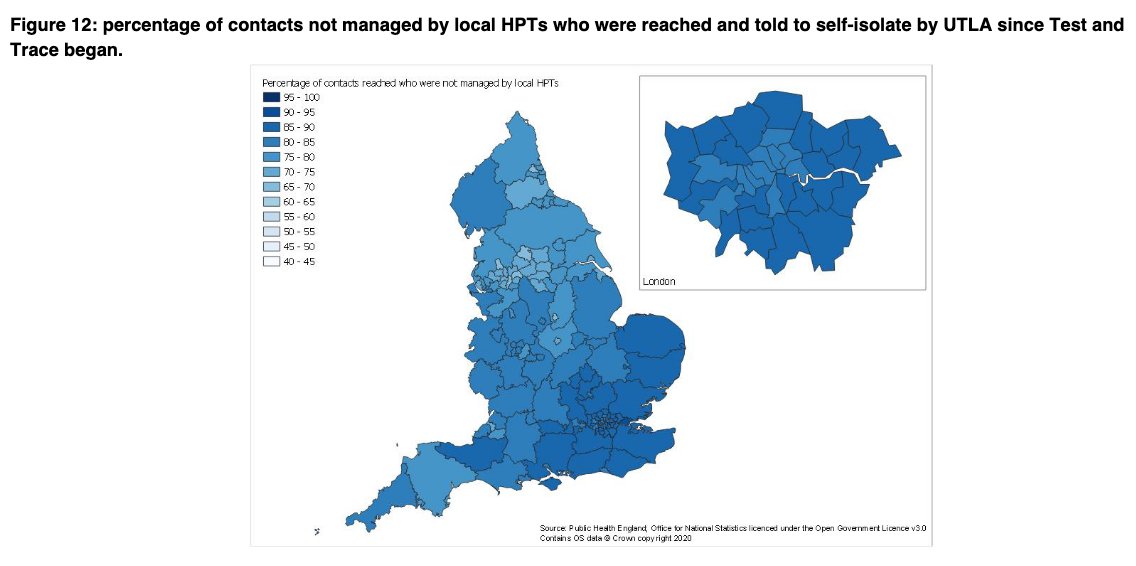
Although, there is variation by local authority in the percentage of cases and contacts reached.
We've did work on this before Christmas
thelancet.com/journals/lance…
We've did work on this before Christmas
thelancet.com/journals/lance…

The time to reach contacts, as well as end to end journey (time from booking test to reaching contacts) has been steady over the past few weeks.
And good relative to overall T&T performance.
And good relative to overall T&T performance.


Finally, these data tell us nothing about who isn't getting tested but should be, and who is struggling to isolate.
On @BBCNewsnight yesterday I tried to explain how critical it is address the issues underlying this for T&T to be a success.
From 20:56⬇️
bbc.co.uk/iplayer/episod…
On @BBCNewsnight yesterday I tried to explain how critical it is address the issues underlying this for T&T to be a success.
From 20:56⬇️
bbc.co.uk/iplayer/episod…
And whilst isolation support is hugely important, it's also about tackling the thorny underlying structural drivers of inequalities.
https://twitter.com/ADMBriggs/status/1364992402533068800?s=20
Wk 38 T&T☝️ @felly500 @trishgreenhalgh @deb_cohen @martinmckee @carolecadwalla @mgtmccartney @ADPHUK
@Jeanelleuk @fascinatorfun @profchrisham @petermbenglish
@HPIAndyCowper @Davewwest @HSJEditor @KateAlvanley
@IndependentSage @nedwards_1 @chrischirp @SamanthaJonesUK
@Jeanelleuk @fascinatorfun @profchrisham @petermbenglish
@HPIAndyCowper @Davewwest @HSJEditor @KateAlvanley
@IndependentSage @nedwards_1 @chrischirp @SamanthaJonesUK
@ewanbirney @TimHarford @devisridhar @FurberA @andrewleedr @kieran_walshe @DrChadborn @Dr_D_Robertson
• • •
Missing some Tweet in this thread? You can try to
force a refresh