This week's PHE surveillance report now out. Covers 15-21 Feb (half term).
Case rates falling, vaccinations increasing, but inequalities being exposed and still a lot of people in hospital and on ICU. 🧵
gov.uk/government/sta…
Case rates falling, vaccinations increasing, but inequalities being exposed and still a lot of people in hospital and on ICU. 🧵
gov.uk/government/sta…
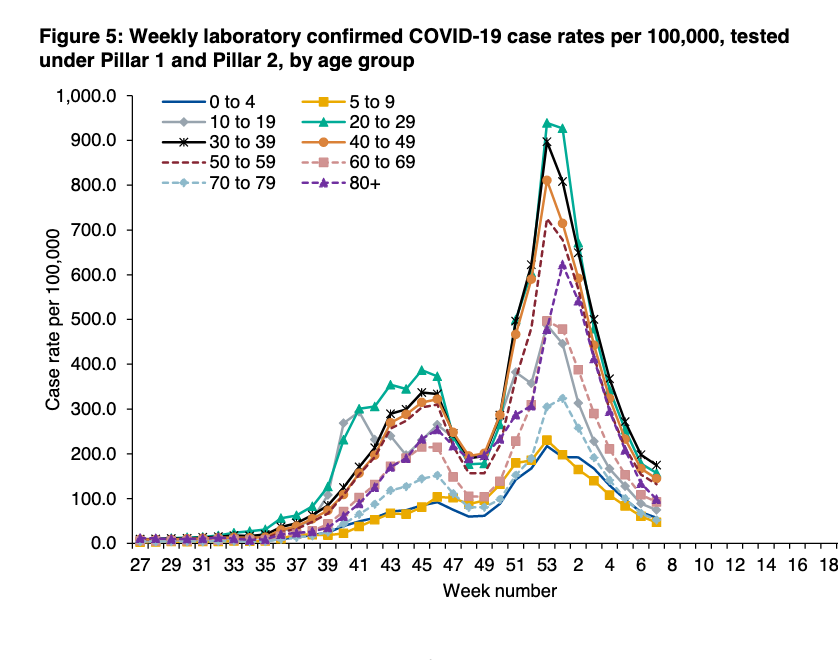
Fall in case rates beginning to level off except in 70-79yrs and 80+, the vaccine is playing it's part! 
For regions, there is now a distinct and worrying split between low case rates in the south of England, and higher case rates in the north.


Again, as case rates fall, the structural inequalities underpinning much of this pandemic are exposed.
Places where people can't work from home or live in multiple occupancy households are going to come out lockdown with higher case rates than elsewhere in the country.
Places where people can't work from home or live in multiple occupancy households are going to come out lockdown with higher case rates than elsewhere in the country.

This means that the socioeconomic recovery will be slowest in the places that need it most.
It is in everyone's interests to address the structural drivers to inequality for reasons of social justice, health, productivity, new variants, econ recovery etc
It is in everyone's interests to address the structural drivers to inequality for reasons of social justice, health, productivity, new variants, econ recovery etc
https://twitter.com/ADMBriggs/status/1364002381244030978?s=20
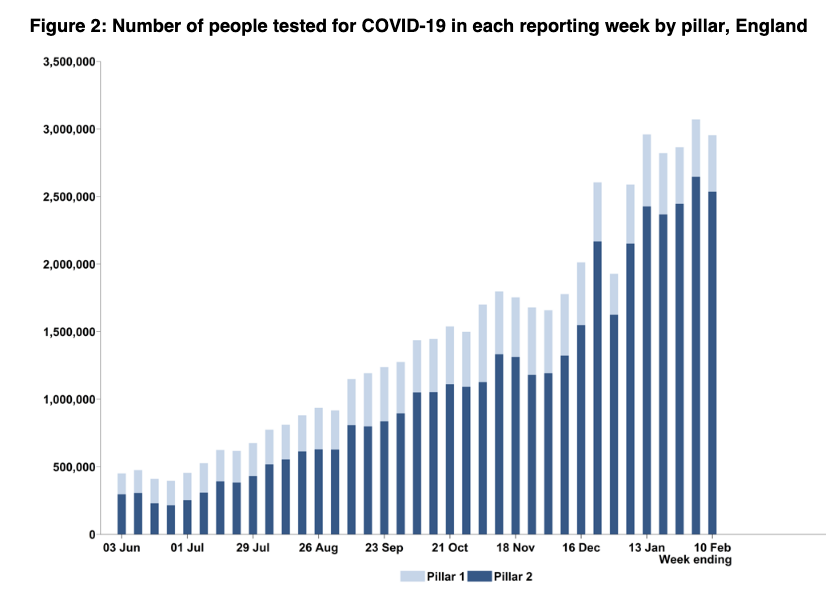
Fairly big drop in lateral flow device use (LFDs, rapid tests for those without symptoms) given half term and much of that is being done in schools.
This means pillar 2 positivity rate has plateaued (includes both PCR tests for those with symptoms as well as LFDs)
This means pillar 2 positivity rate has plateaued (includes both PCR tests for those with symptoms as well as LFDs)


This likely explains the uptick in positivity among 10-19yr olds. The 5-9 and 0-4 higher positivity rates could be due to a range of reasons, but fortunately this isn't reflected in higher case rates in surveys or PHE data.
https://twitter.com/ADMBriggs/status/1362512256039272451?s=20

Differences in infection rates by ethnicity are less stark than they were, but still very apparent in some regions.


And differences by deprivation group remain as bold as ever as case rates drop.

Still outbreaks in care homes reported to PHE despite vaccination, it's not a huge jump in number but shows we're not out of woods despite the amazing vax effort.
Also, among those infected who have been vaccinated, they will have a markedly lower risk of severe disease.
Also, among those infected who have been vaccinated, they will have a markedly lower risk of severe disease.

Number of outbreaks in hospitals that are reported to PHE remains v low

And schools haven't been open.

Finally, really good to see a drop among workplace settings.

Hospitalisation rates continue to fall sharply, driven by older age groups.


There isn't a significant difference between hospitalisation rates in the regions either, but this is worth watching closely.

It's also great that ICU admission rates falling fast as well. Particularly given that ICU is occupied by people who are younger and are less likely to have been vaccinated.


More variation here by region as patients are repatriated to local hospitals when beds become available, and because generally lower numbers.
Admission rates going down everywhere.
Admission rates going down everywhere.

*But* the number of people in hospital and the number on ICU are still at 75% of the first wave peak.


Finally, deaths from COVID may be falling but there's still significant excess mortality.


So whilst it's great that schools are going to open and the vaccines are working, lockdown continues for everyone else.
That's so important, both to try and keep R</=1 as vaccinations increase, and to allow health systems that bit more time to recover.
That's so important, both to try and keep R</=1 as vaccinations increase, and to allow health systems that bit more time to recover.

And beyond the immediate policies aimed at limiting viral transmission, addressing structural inequalities simply can't be ignored.
PHE surveil rpt @felly500 @deb_cohen @martinmckee @carolecadwalla @mgtmccartney @ADPHUK @Jeanelleuk
@fascinatorfun @profchrisham @petermbenglish @HPIAndyCowper @Davewwest @HSJEditor @KateAlvanley
@IndependentSage @nedwards_1 @SamanthaJonesUK
@ewanbirney @FurberA @Dr_D_Robertson
@fascinatorfun @profchrisham @petermbenglish @HPIAndyCowper @Davewwest @HSJEditor @KateAlvanley
@IndependentSage @nedwards_1 @SamanthaJonesUK
@ewanbirney @FurberA @Dr_D_Robertson
• • •
Missing some Tweet in this thread? You can try to
force a refresh