I know others will have found these things before me but I've been home-schooling all day so only getting round to reading the roadmap now.

A few things stick out on first pass

(tl,dr: inequalities, testing, isolation support, social care, and inequalities).
There's a section on 'Test, Trace and Isolate' (who says NHS Test and Trace has a branding problem).

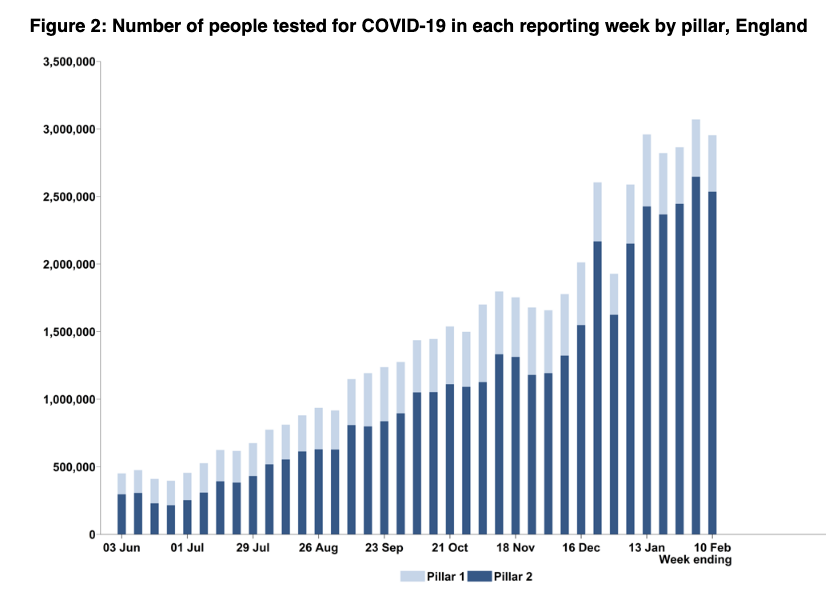
As expected, big focus on testing plus a further £400m for local gov through the contain outbreak mgmt fund - details tbc but likely much is for local testing/variant mgmt. ImageImage
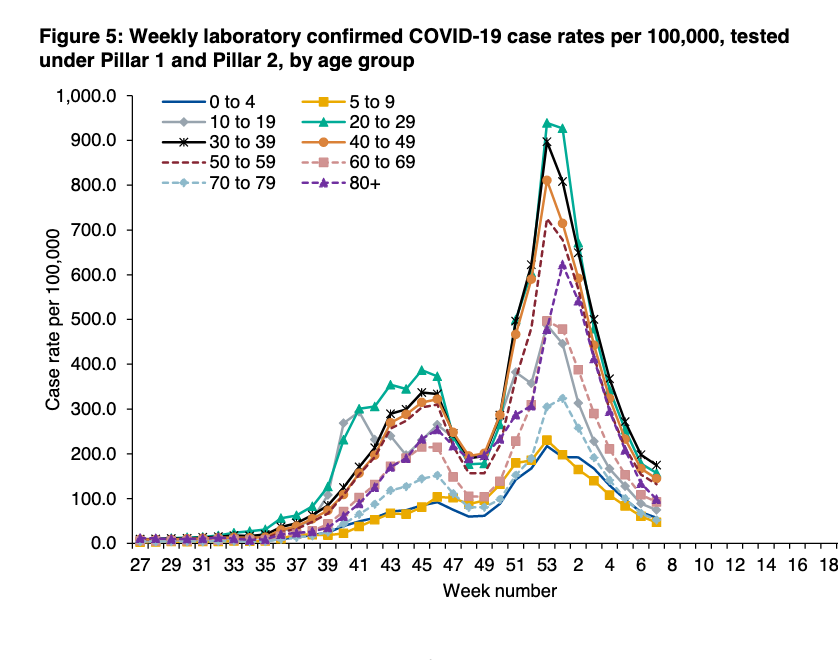
As have said, there remains a big challenge of people not getting tested in the first place (fear of being unable to isolate, job insecurity, caring responsibilities etc). Surveys suggest just 1/3 get tested regularly if symptomatic.
The community collect model is not going to help more underlying structural societal issues. But the added £20m/month for local gov discretionary isolation support payment is v welcome and *will* help.

The next piece missing is work with employers to help those in insecure jobs. ImageImage
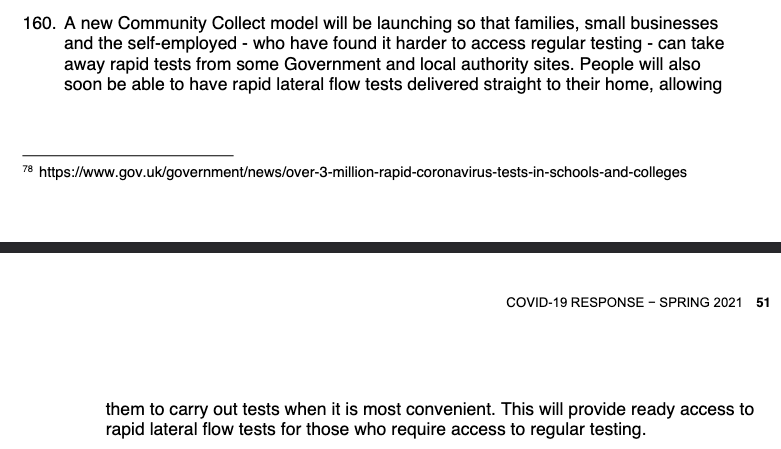
Bit more on testing, nothing on potential alternatives for people who find it difficult to safely isolate at home (multigenerational households etc), and this on regular testing as an alternative to isolation for contacts - lots of pilots but not ready yet. Image
There's plenty of what gov has done for care homes - but no more hints about any more substantive long term social care reform (also missing from the recently announced NHS reform plans)

And there's a short section on 'disproportionately impacted groups' (note, the word 'inequalities' isn't mentioned in the report once).

COVID loves inequalities, both directly & indirectly disproportionately impacting those least able to cope.
Inequalities must be front and center of all gov policy - both to directly limit transmission, and as central to an inclusive long-term socioeconomic recovery.

A commitment around new approaches to viral spread won't be enough. Image
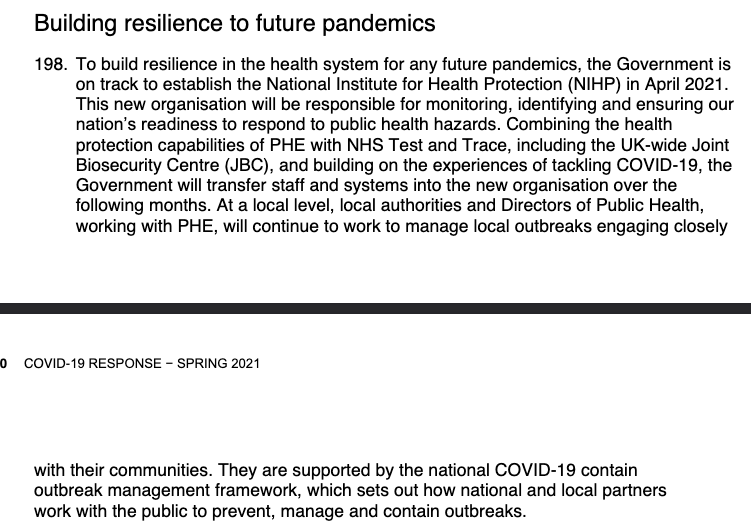
Furthermore, resilience to future pandemics is far more than the establishment of the National Institute for Health Protection and improved outbreak mgmt.

It means a cross-gov approach to inequalities that ensures everyone is able to withstand future socioeconomic shocks. Image
This was put much more clearly by @JenniferTHF earlier today.

health.org.uk/news-and-comme…

• • •

Missing some Tweet in this thread? You can try to force a refresh
 

Keep Current with Adam Briggs

Adam Briggs Profile picture

Stay in touch and get notified when new unrolls are available from this author!

Read all threads

This Thread may be Removed Anytime!

PDF

Twitter may remove this content at anytime! Save it as PDF for later use!

Try unrolling a thread yourself!

how to unroll video
  1. Follow @ThreadReaderApp to mention us!

  2. From a Twitter thread mention us with a keyword "unroll"
@threadreaderapp unroll

Practice here first or read more on our help page!

More from @ADMBriggs

25 Feb
This week's PHE surveillance report now out. Covers 15-21 Feb (half term).

Case rates falling, vaccinations increasing, but inequalities being exposed and still a lot of people in hospital and on ICU. 🧵

gov.uk/government/sta…
Fall in case rates beginning to level off except in 70-79yrs and 80+, the vaccine is playing it's part! Image
For regions, there is now a distinct and worrying split between low case rates in the south of England, and higher case rates in the north. ImageImage
Read 22 tweets
18 Feb
This week's PHE COVID surveillance report now out.

Most recent week covers 8th-14th Feb.

tl,dr: Things continue to improve but NHS bed/ICU situation has only *just* dipped below April peak. And some potentially worrying regional variation.

gov.uk/government/sta…
Case rates and positivity falling relatively fast. And across all ages.
Percentage of tests positive also falling, but this pillar 2 (community testing) graph has also been causing people some concern re young school children and returning to school - despite reported case rates being the lowest of all age gps.
Read 23 tweets
18 Feb
Most recent T&T data now out, covers 4th - 10th Feb

LFD use continues to rise but more slowly than last week and T&T performance remains consistent.

And as ever we don't know about who isn't tested and who struggles to isolate.

🧵

gov.uk/government/pub…
The number of people being tested each week remains high at around 3m, but this is due to increasing use of rapid lateral flow devices as PCR test use falls.
The number of LFDs used has increased five-fold since the start of Jan, and 35% in the past two weeks (although noticeable slowdown this most recent week).

By contrast, PCR test use for people with symptoms fallen week on week for the past month (PHE positivity data due later).
Read 17 tweets
18 Feb
Latest REACT-1 study results are really important.

The headline result of prevalence now at around 0.5% masks big differences by region, employment type, HH size, and keyworker status.

(and note - in the summer, prevalence was more like 0.05-0.1%)

1/5

spiral.imperial.ac.uk/bitstream/1004…
Relative drop in prevalence between round 8 (6th-22nd Jan) and 9a (4th-13th Feb) is far greater in the S than the N and may be plateauing at around 1% in the NE.

It's helpful to know that trends in REACT generally follow trends in national PCR positivity data (in red). 2/5
Differences by deprivation group exposed yet again, plus if living in large households. Less stark differences by ethnicity (although v wide confidence intervals).

And this is AFTER adjustment for things like age, region, key work status, HH size, deprivation, ethnicity. 3/5
Read 5 tweets
14 Feb
Latest Test and Trace data now out. Covers to 3rd Feb.

Some useful separation of LFD and PCR tests, and new data on end-to-end contact tracing.

Summary in figure,🧵for the detail.

gov.uk/government/pub…
As case rates fall across the country, the number of people being tested is up 7% of last week to over 3m for the first time.

Over 5% of the population.
And as you can see from PHE data to 7th Feb - the increase is from the use of lateral flow devices (LFDs) to find cases among people without symptoms.

The number of people tested using PCR tests each week (and the proportion coming back positive - positivity) is still falling.
Read 24 tweets
11 Feb
This week's @PHE_uk COVID surveillance report is now out. Covers 1-7 Feb.

It's going in the right direction but still pockets of high case rates & hospitals are still far from getting back to anything like 'normal'.

Pls keep going, it's getting better.🧵
gov.uk/government/sta…
Case rates and positivity rates (percentage of tests coming back positive) continue to decline in all ages and everywhere.

The steep decline in 20-49yr olds is really striking.
The figures of age by region show how in some regions, the decline by age isn't so prominent.

For example, 80+ in NE and West Mids.
Read 19 tweets

Did Thread Reader help you today?

Support us! We are indie developers!


This site is made by just two indie developers on a laptop doing marketing, support and development! Read more about the story.

Become a Premium Member ($3/month or $30/year) and get exclusive features!

Become Premium

Too expensive? Make a small donation by buying us coffee ($5) or help with server cost ($10)

Donate via Paypal Become our Patreon

Thank you for your support!

Follow Us on Twitter!