Mise à jour du Québec

#covid19Qc #covid19canada #COVID19

Automne / hiver au Québec : On peut être en mesure de déclarer un pic quand croissance moyenne d'une semaine à l'autre s'approche de zéro.
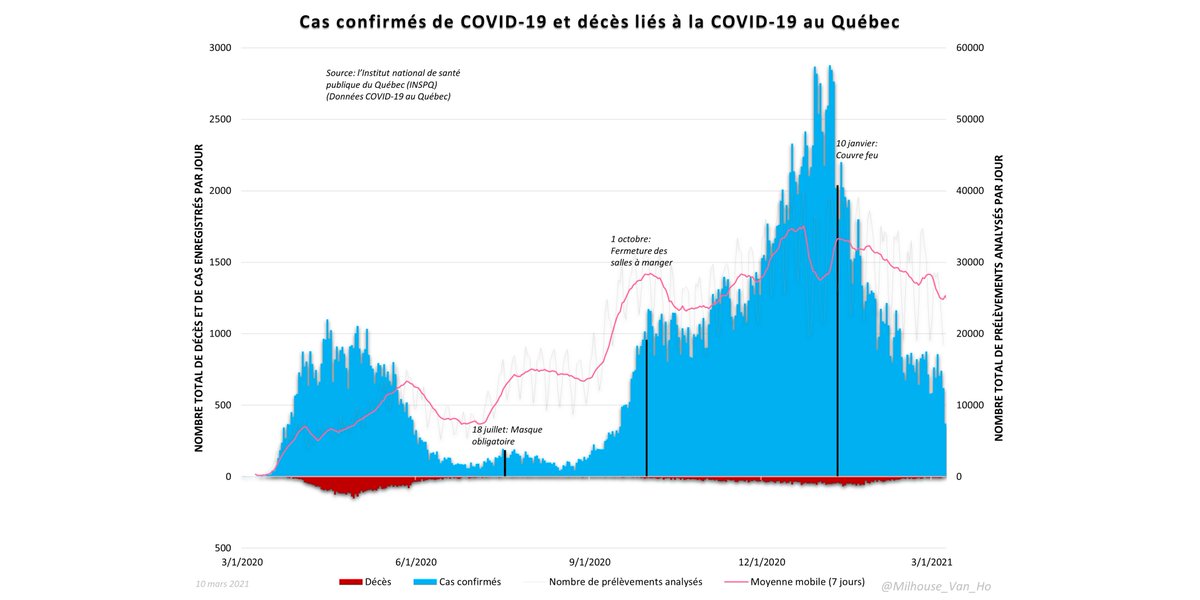
Nombre total de cas et de décès liés à Covid-19 au Québec.
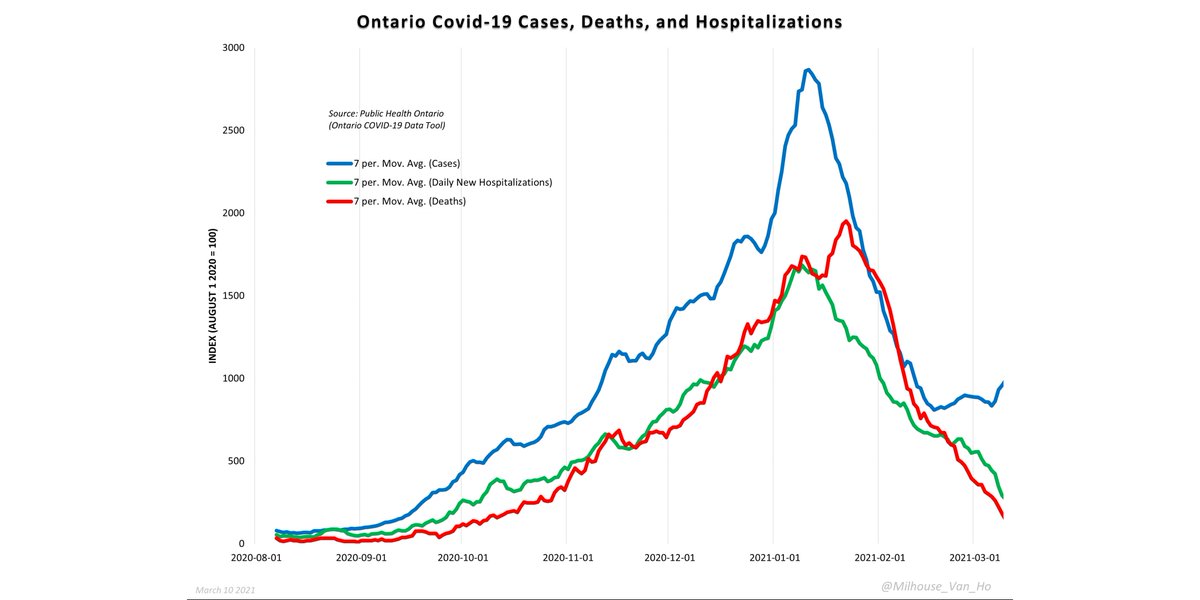
Nombre total de cas, de décès, et d’hospitalisations en cours liés à Covid-19 au Québec.
Nouvelles hospitalisations liées à la COVID-19 au Québec.
La proportion de cas entraînant la mort (décès enregistrés par jour / cas quotidiens moyens au cours des 28 derniers jours) (ligne jaune).
Cas cumulés en pourcentage des décès cumulés (taux de mortalité clinique) (ligne jaune).
Nombre total de décès hebdomadaires au Québec de janvier 2010 à décembre 2020.

• • •

Missing some Tweet in this thread? You can try to force a refresh
 

Keep Current with Milhouse Van Houten 😀

Milhouse Van Houten 😀 Profile picture

Stay in touch and get notified when new unrolls are available from this author!

Read all threads

This Thread may be Removed Anytime!

PDF

Twitter may remove this content at anytime! Save it as PDF for later use!

Try unrolling a thread yourself!

how to unroll video
  1. Follow @ThreadReaderApp to mention us!

  2. From a Twitter thread mention us with a keyword "unroll"
@threadreaderapp unroll

Practice here first or read more on our help page!

More from @Milhouse_Van_Ho

11 Mar
Mortality in Canada (thread):

Here we have the total number of deaths in Canada over the past five years. Image
Zooming out nationally over the past decade, we see that it's natural for deaths in one year to exceed deaths in the previous year (blue line > 0%). Note that a year of low or negative growth is often followed by a year of much higher growth. Image
Here we have the chart you saw earlier now expressed as a rate per 100,000 people. Generally, a flatter trend in death rates would suggest that population growth may be a key factor driving growth in total deaths. Image
Read 17 tweets
10 Mar
I suspect there's something artificial about Ontario's case numbers because they no longer match hospitalization and death trends, nor comparable trends in neighbouring Québec.

Thread:
Charts demonstrating covid seasonality.

Neighbouring provinces of Ontario and Québec both peaked at virtually the same time. However, cases trending up again in Ontario - but not in Québec.
On the contrary, hospitalizations in both provinces are still trending downward in unison.
Read 8 tweets
10 Mar
Ontario update.

#covid19ontario #COVID19 #covid19Canada

Ontario Fall/Winter season: May be able to declare a peak when average week-over-week growth reaches zero.
Ontario covid-19 cases, hospitalizations, deaths, and testing.
Ontario covid-19 cases, deaths, and testing.
Read 15 tweets
9 Mar
Greater Toronto update (thread).

#covid19 #covid19toronto #covid19ontario

City of Toronto cases, hospitalizations, deaths.
City of Toronto - The proportion of cases (positive test results) resulting in death (yellow line).
Greater Toronto cases, hospitalizations, deaths.
Read 8 tweets
5 Mar
Ontario update.

#covid19ontario #COVID19 #covid19Canada

Ontario Fall/Winter season: May be able to declare a peak when average week-over-week growth reaches zero.
Ontario covid-19 cases, hospitalizations, deaths, and testing.
Ontario covid-19 cases, deaths, and testing.
Read 15 tweets

Did Thread Reader help you today?

Support us! We are indie developers!


This site is made by just two indie developers on a laptop doing marketing, support and development! Read more about the story.

Become a Premium Member ($3/month or $30/year) and get exclusive features!

Become Premium

Too expensive? Make a small donation by buying us coffee ($5) or help with server cost ($10)

Donate via Paypal Become our Patreon

Thank you for your support!

Follow Us on Twitter!