Today, the headlines enjoyed the @CommonsPAC report on COVID19: Test, Track and Trace (part 1).

Some reflections that don't focus on the ££ detail. 🧵1/11

committees.parliament.uk/publications/4…
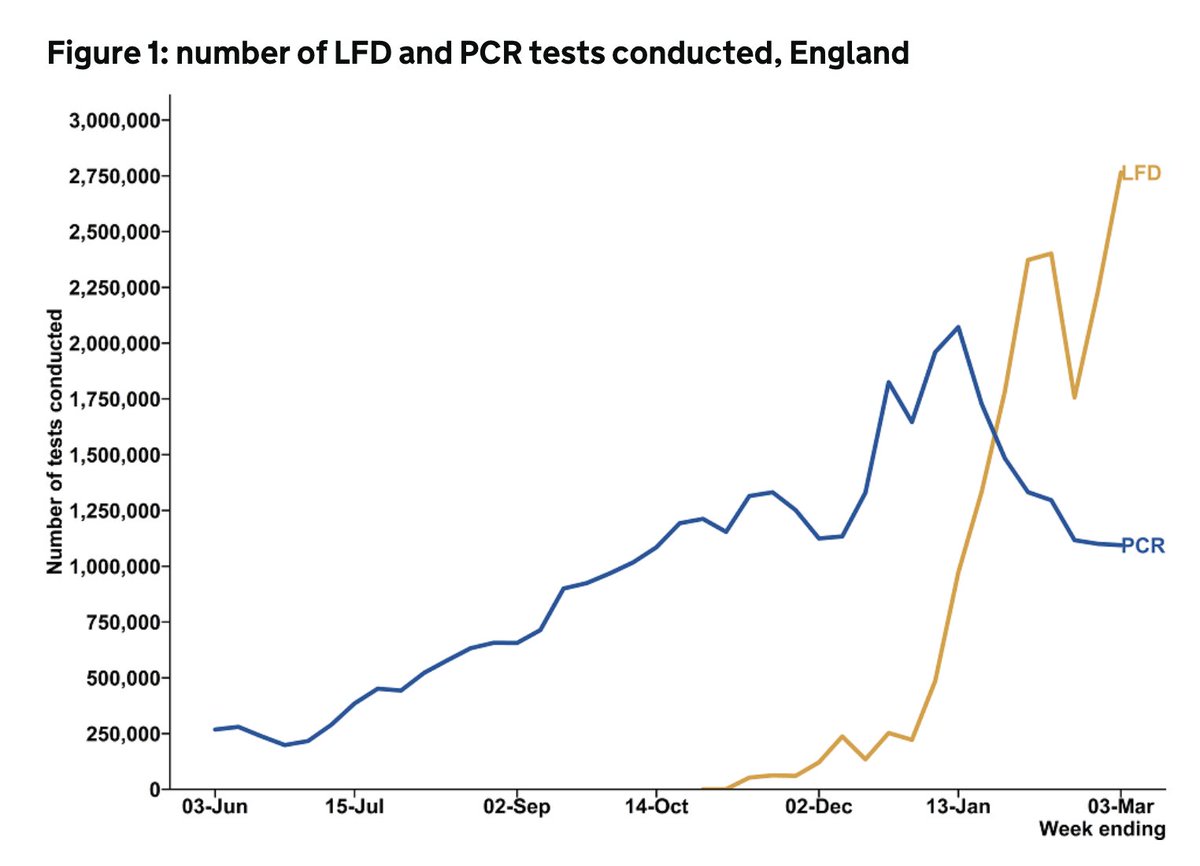
The T&T budget is massive, and it's right that it has scrutiny. The vast majority (perhaps around 80%) has gone on testing and the achievements here are pretty significant.

Regularly >5% of population are tested for a disease that we didn't know existed around a yr ago. 2/
But by the same token relatively little has been spend on the contact tracing and isolation support.

We can't test our way out of the pandemic - it has to go hand in hand with tracing contacts and ensuring people have the support they need to isolate. 3/
The weekly T&T data don't tell us who doesn't get tested despite having symptoms (COVID Social Study suggests that only around 1/3 regular test if symptomatic)

and who struggles to adhere to isolation guidance (CORSAIR study suggests perhaps as little as 1 in 5 fully adhere). 4/
We address these specific points around testing, contact tracing, isolation, and inequalities in our original @HealthFdn submission to the @CommonsPAC.

Can read more here:
health.org.uk/news-and-comme… 5/
The PAC report usefully highlights that local gov should have been more directly involved early on & recommends more engagement with public health and local stakeholders.

And whilst a lot has changed since T&T launched, local gov and community engagement will remain critical 6/
COVID's exposed and exacerbated inequalities across society.

Moving forward, test/trace/isolation policies need to be co-designed with the local authorities and communities that have been most impacted by COVID, and who have the most to gain from the reopening of society. 7/
This needs to happen alongside a coordinated cross gov approach to the deep structural drivers of inequalities & enduring transmission across more deprived parts of the country.

With local gov/regional flexibility & resource to address their ongoing local challenges. 8/
Without this, the parts of the country that are least able to cope will have ongoing transmission, more lockdowns, more economic and social isolation, more direct and indirect harm, more variants, and more inequalities.

As a society, this shouldn't in any way be tolerable. 9/
So while the report makes some very helpful T&T-specific recommendations, the success of NHS T&T and the broader COVID response also depends on the gov meaningfully engaging in the wider structural drivers of inequalities in England 10/
And many of the necessary policy actions and investments required are dealt with here:
health.org.uk/publications/b… 11/11

• • •

Missing some Tweet in this thread? You can try to force a refresh
 

Keep Current with Adam Briggs

Adam Briggs Profile picture

Stay in touch and get notified when new unrolls are available from this author!

Read all threads

This Thread may be Removed Anytime!

PDF

Twitter may remove this content at anytime! Save it as PDF for later use!

Try unrolling a thread yourself!

how to unroll video
  1. Follow @ThreadReaderApp to mention us!

  2. From a Twitter thread mention us with a keyword "unroll"
@threadreaderapp unroll

Practice here first or read more on our help page!

More from @ADMBriggs

11 Mar
This week's T&T report. Covers 25th Feb - 3rd March.

Tl,dr:
More LFDs - esp in secondary schools,
fewer cases,
more close contacts per case,
and fewer of them from the same household as the case.

Detail in 🧵

gov.uk/government/pub… Image
A pretty astonishing 3.13 million people tested in the week.

This is the most since T&T launched. Until next week's data. Image
This is because of the large scale roll-out of LFDs.

There were 2.76m used in week ending 3rd March, compared with 2.23 the week before, with 2/3 of the increase in use coming from secondary schools.

PCR use dropped slightly over the same period. ImageImageImage
Read 18 tweets
11 Mar
This week's PHE COVID surveillance report, covering 1-7th March (just before schools fully reopened)

Case rates, hospitalisations, deaths continue to fall.
But some really big variation by local authority.

And vaccination uptake is going great guns. 🧵

gov.uk/government/sta…
Case numbers and percentage testing positive (positivity) still falling across community testing (pillar 2) and health care worker/those in clinical need tests (pillar 1). Image
The steep drop in P2 positivity is due to the massive jump in LFD use (lateral flow devices for rapid testing among people without symptoms)

2.8m done between 1st-7th March, with a positivity of 0.17% compared with 1.7m done the week before. LFD use will rise further next wk. Image
Read 18 tweets
4 Mar
Latest T&T data out, covers 18-24th Feb.

Bit of a dive into testing and LFD use this week.

Tl,dr: Tests up (all LFDs), cases down, and performance relatively unchanged.

Summary in pic, detail in 🧵

gov.uk/government/pub…
There were 2.8m people tested, up 9% on the week before but still down from 3m two weeks' before.

This was all pillar 2 (community testing), up 14%. People tested using pillar 1 (HCWs and those in clinical need) fell 12%.
And more specifically, this was all lateral flow devices (LFDs) - rapid tests for people aiming to find cases among those without symptoms.

The number of LFDs used increased by 470k to 2.2m, whereas the number of pillar 2 PCR tests dropped slightly.
Read 19 tweets
4 Mar
PHE COVID surveillance report out covering 22nd-28th Feb, plus also today's REACT data. 🧵

tl,dr. Things are getting better but inequalities continue to persist.

gov.uk/government/sta…
Case rates have continued to drop in all ages.

And check out how rates in 80+y/o were tracking with those aged 20-60yrs
but over the last few weeks the rate of decline has accelerated to track more closely with those aged 60-80yrs.
After positivity went a bit wild last week (half term and therefore far fewer LFDs being done) reassuring it's back to similar trends to the week before.

Having said this, pillar 2 positivity is really hard to interpret now as includes LFDs and PCR.
Read 21 tweets
4 Mar
Latest REACT-1 study now published suggesting prevalence of COVID in England of 0.5% between 4th-23rd Feb (round 9).

Two-thirds lower than the 1.6% reported over the same period in Jan (round 8).

But big variation by region, ethnicity, and deprivation. 1/4
Higher chance of infection among Asian ethnic groups, if more deprived, bigger households, and if health/care worker. 2/4
And whilst still declining everywhere, higher prevalence in NE, London, East Mids, with some signs that falls are stalling in London, West Mids, and SE.

Finally, lowest prevalence in 65+ but big drops across the board. 3/4
Read 4 tweets
26 Feb
This week's T&T update. Covers 11th-17th Feb.

Tl,dr
testing, cases, and contacts all down
performance steady
and a critical need to tackle inequalities.

gov.uk/government/pub…
First decent fall in number of people being tested this week (not including Christmas/NY).

Down 14% to 2.6m.
Lateral flow device (LFD) use for people w/o symptoms has fallen for the first time as well as PCR.

Part this will be because this week covers the first few days of the school half term (15-19 Feb) and much of LFD use is in schools.

Would expect this to bounce up again next wk
Read 19 tweets

Did Thread Reader help you today?

Support us! We are indie developers!


This site is made by just two indie developers on a laptop doing marketing, support and development! Read more about the story.

Become a Premium Member ($3/month or $30/year) and get exclusive features!

Become Premium

Too expensive? Make a small donation by buying us coffee ($5) or help with server cost ($10)

Donate via Paypal Become our Patreon

Thank you for your support!

Follow Us on Twitter!