This week's T&T report. Covers 25th Feb - 3rd March.
Tl,dr:
More LFDs - esp in secondary schools,
fewer cases,
more close contacts per case,
and fewer of them from the same household as the case.
Detail in 🧵
gov.uk/government/pub…
Tl,dr:
More LFDs - esp in secondary schools,
fewer cases,
more close contacts per case,
and fewer of them from the same household as the case.
Detail in 🧵
gov.uk/government/pub…

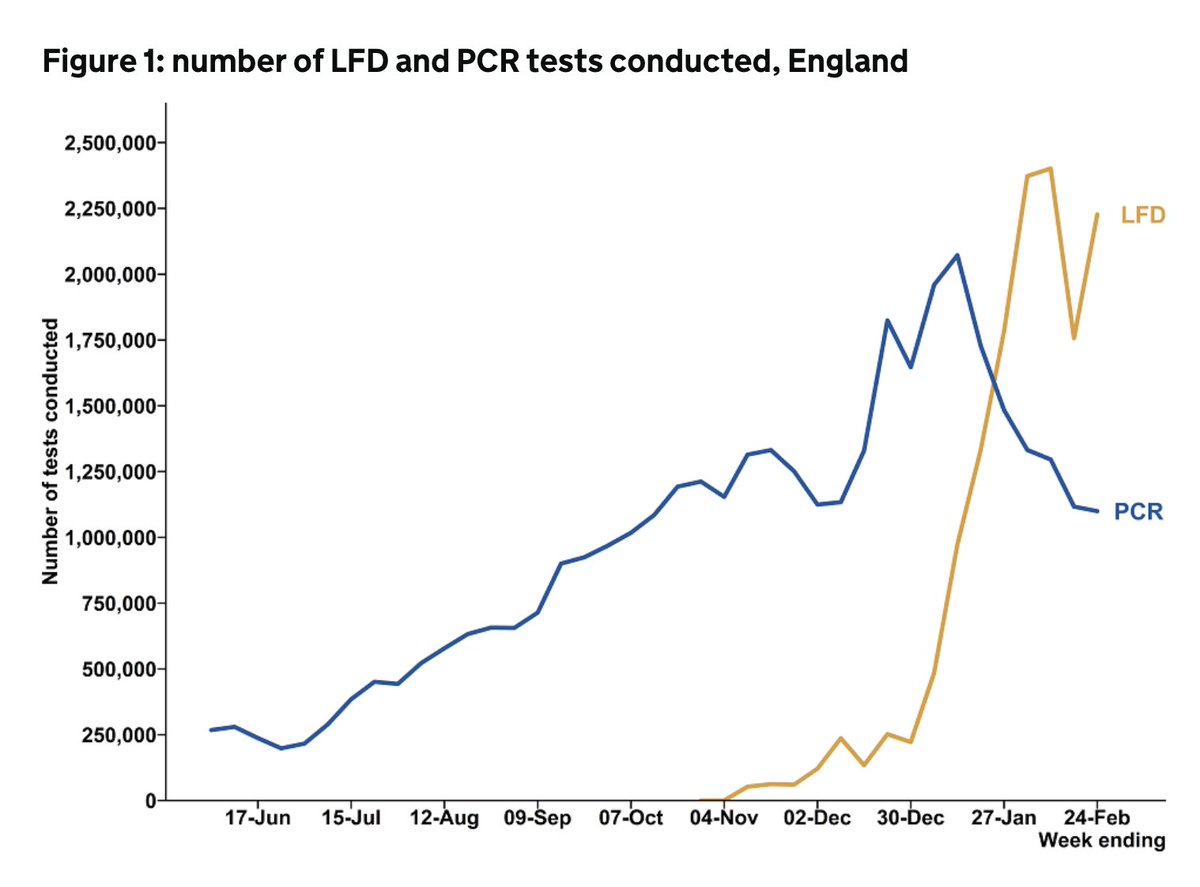
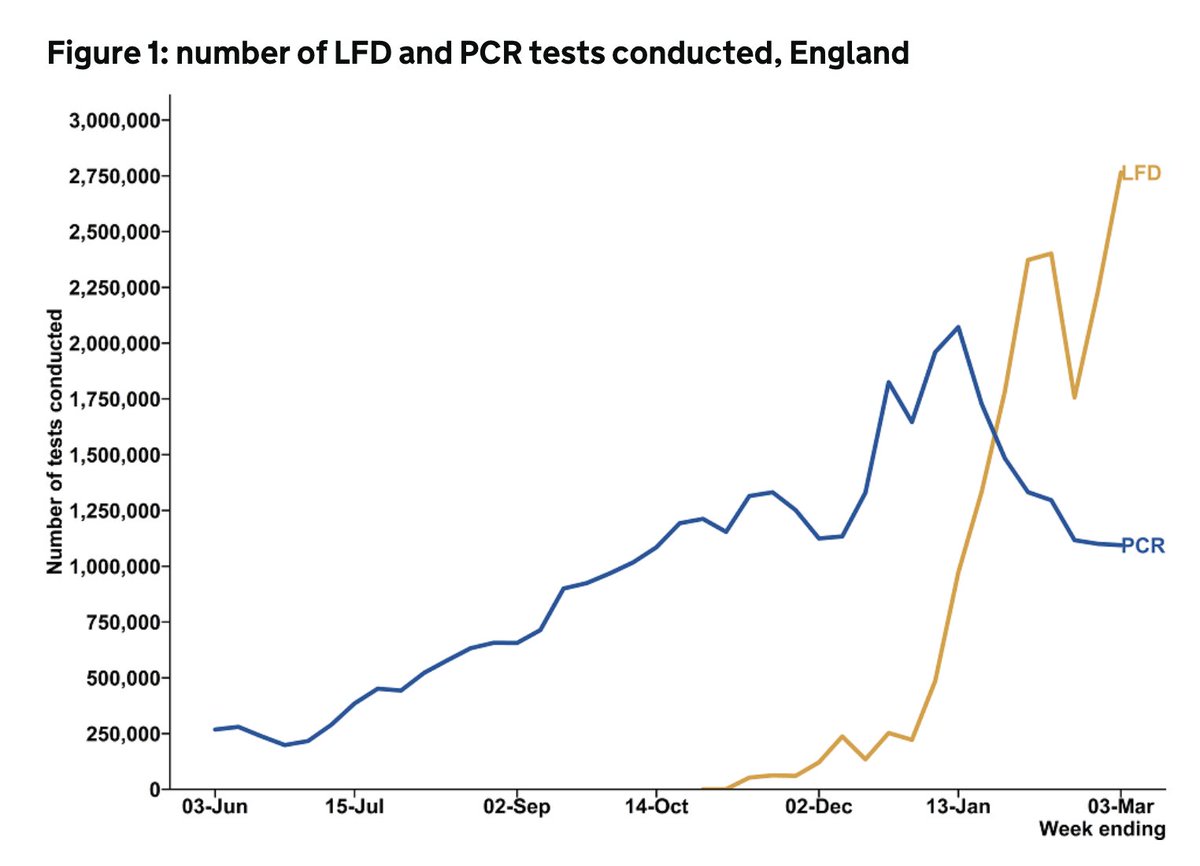
A pretty astonishing 3.13 million people tested in the week.
This is the most since T&T launched. Until next week's data.
This is the most since T&T launched. Until next week's data.

This is because of the large scale roll-out of LFDs.
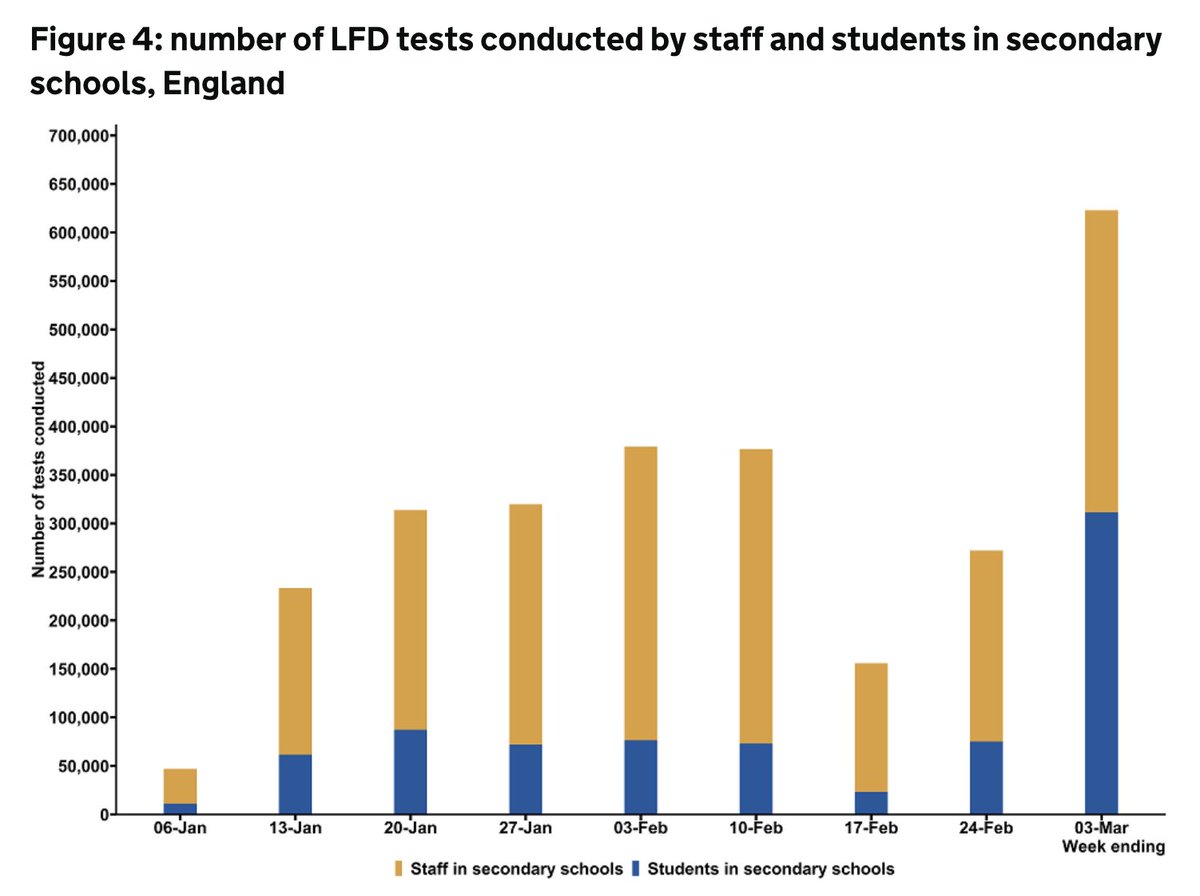
There were 2.76m used in week ending 3rd March, compared with 2.23 the week before, with 2/3 of the increase in use coming from secondary schools.
PCR use dropped slightly over the same period.
There were 2.76m used in week ending 3rd March, compared with 2.23 the week before, with 2/3 of the increase in use coming from secondary schools.
PCR use dropped slightly over the same period.

LFDs have had 4,353 positives. Potential cases that might otherwise not have been known about or isolating.
The new gov.uk dashboard suggests that in England between 25/2 and 03/3 there were 1,410 LFD positives confirmed by PCR, and 2,542 unconfirmed.
The new gov.uk dashboard suggests that in England between 25/2 and 03/3 there were 1,410 LFD positives confirmed by PCR, and 2,542 unconfirmed.
This suggests 401 of the positive LFDs reported in T&T data had negative PCR tests. Around 23% of LFDs having a subsequent PCR.
There will be some false pos among the LFDs not confirmed by PCR, and some of the neg PCRs following the pos LFD will be false neg.
But the total overall is not known and sens/spec of LFDs still being debated. This paper sets much of that out.
gov.uk/government/pub…
But the total overall is not known and sens/spec of LFDs still being debated. This paper sets much of that out.
gov.uk/government/pub…
PHE report 0.17% positivity overall for 1-7 March.
For secondary schools in T&T it was 0.05%, for primary schools was 0.08%.
Both consistently falling over the previous four weeks (was 0.07% and 0.12% the week before).
Void rates are 0.16% for both setting and no clear trend.
For secondary schools in T&T it was 0.05%, for primary schools was 0.08%.
Both consistently falling over the previous four weeks (was 0.07% and 0.12% the week before).
Void rates are 0.16% for both setting and no clear trend.

Over a million LFDs a day have been done since 8th March, so lots more data to come and will be v interesting to follow positivity and also whether such high rates of school uptake continue.

Overall case numbers fell by 34%, with 44.5k handled by T&T and 89% reached.


Similar proportion of cases provided details of contacts as previous weeks.

But more contacts identified per case than previous weeks - up to 2.5, the highest since mid Nov last year.

Dip in the percentage of these contacts reached this week, to 91% and the lowest since the system for reaching household contacts was change in early Dec.

This is because of the first significant drop in weeks in the percentage of contacts that are from the same household.
The percentage of HH contacts reached is the same at 97%, but for non-HH it's 69%.
The percentage of HH contacts reached is the same at 97%, but for non-HH it's 69%.

The percentage of close contacts that are from the same HH has been edging down for a few weeks but this is a big drop - the week before schools fully reopened. Alongside more contacts per case.
It suggests more mixing going on.
It suggests more mixing going on.
Slightly mixed pic on time taken to reach cases and contacts. End to end journey time similar to last week, but smaller percentage of contacts reached within 3 days of case taking test.
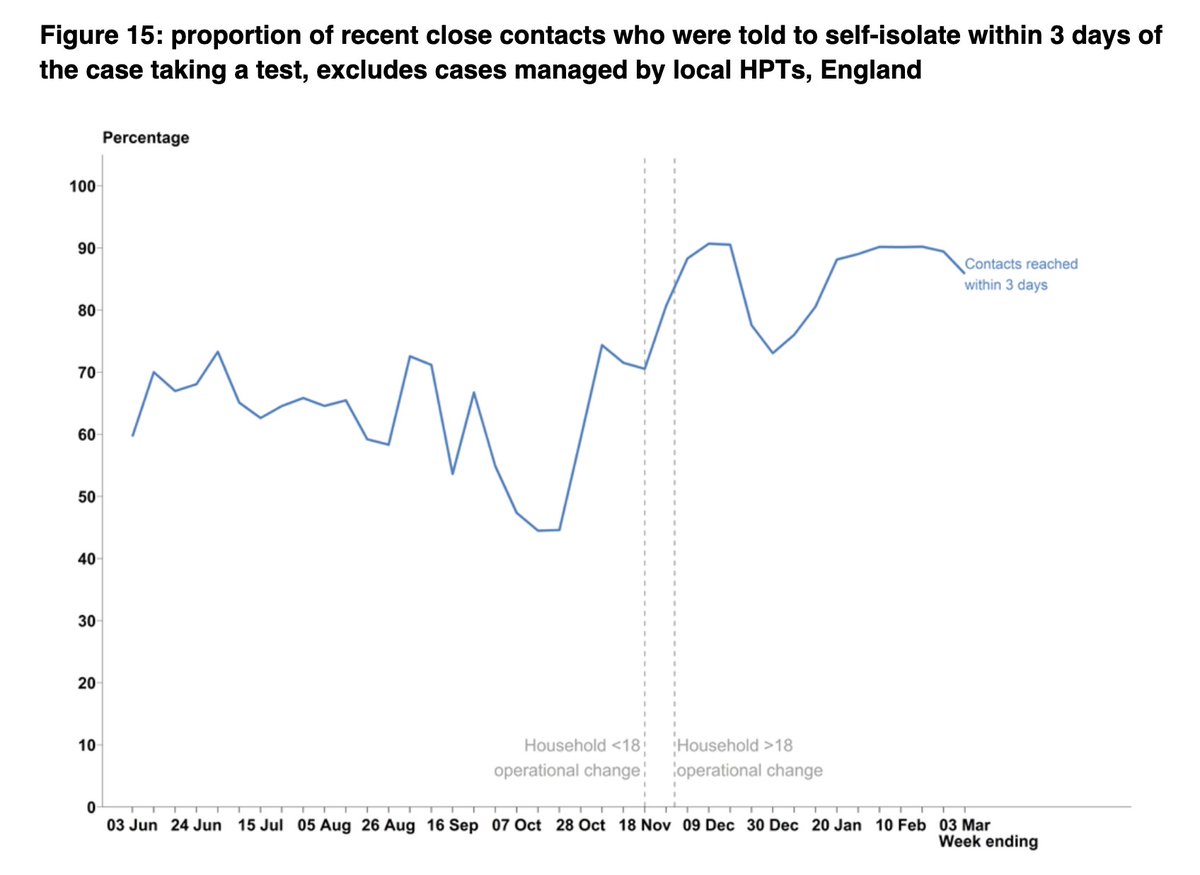


For time to PCR test result, not dissimilar to previous weeks.


wk 40 T&T ☝️ @felly500 @trishgreenhalgh @deb_cohen @martinmckee @carolecadwalla @mgtmccartney @ADPHUK
@Jeanelleuk @fascinatorfun @profchrisham @petermbenglish
@HPIAndyCowper @Davewwest @HSJEditor @KateAlvanley
@IndependentSage @nedwards_1 @chrischirp @SamanthaJonesUK
@Jeanelleuk @fascinatorfun @profchrisham @petermbenglish
@HPIAndyCowper @Davewwest @HSJEditor @KateAlvanley
@IndependentSage @nedwards_1 @chrischirp @SamanthaJonesUK
@ewanbirney
@TimHarford
@devisridhar
@FurberA
@andrewleedr
@kieran_walshe
@DrChadborn
@Dr_D_Robertson
@TimHarford
@devisridhar
@FurberA
@andrewleedr
@kieran_walshe
@DrChadborn
@Dr_D_Robertson
• • •
Missing some Tweet in this thread? You can try to
force a refresh