This week's PHE COVID surveillance report, covering 1-7th March (just before schools fully reopened)
Case rates, hospitalisations, deaths continue to fall.
But some really big variation by local authority.
And vaccination uptake is going great guns. 🧵
gov.uk/government/sta…
Case rates, hospitalisations, deaths continue to fall.
But some really big variation by local authority.
And vaccination uptake is going great guns. 🧵
gov.uk/government/sta…
Case numbers and percentage testing positive (positivity) still falling across community testing (pillar 2) and health care worker/those in clinical need tests (pillar 1). 

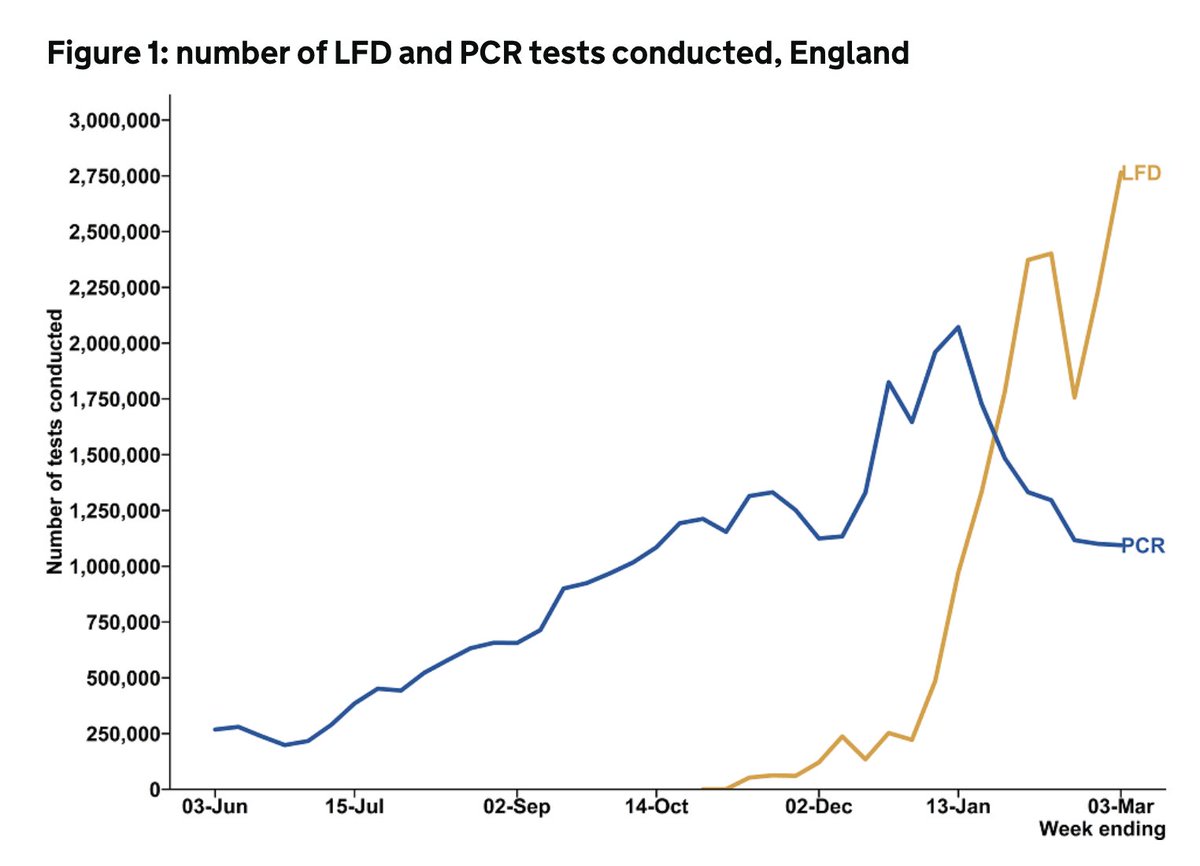
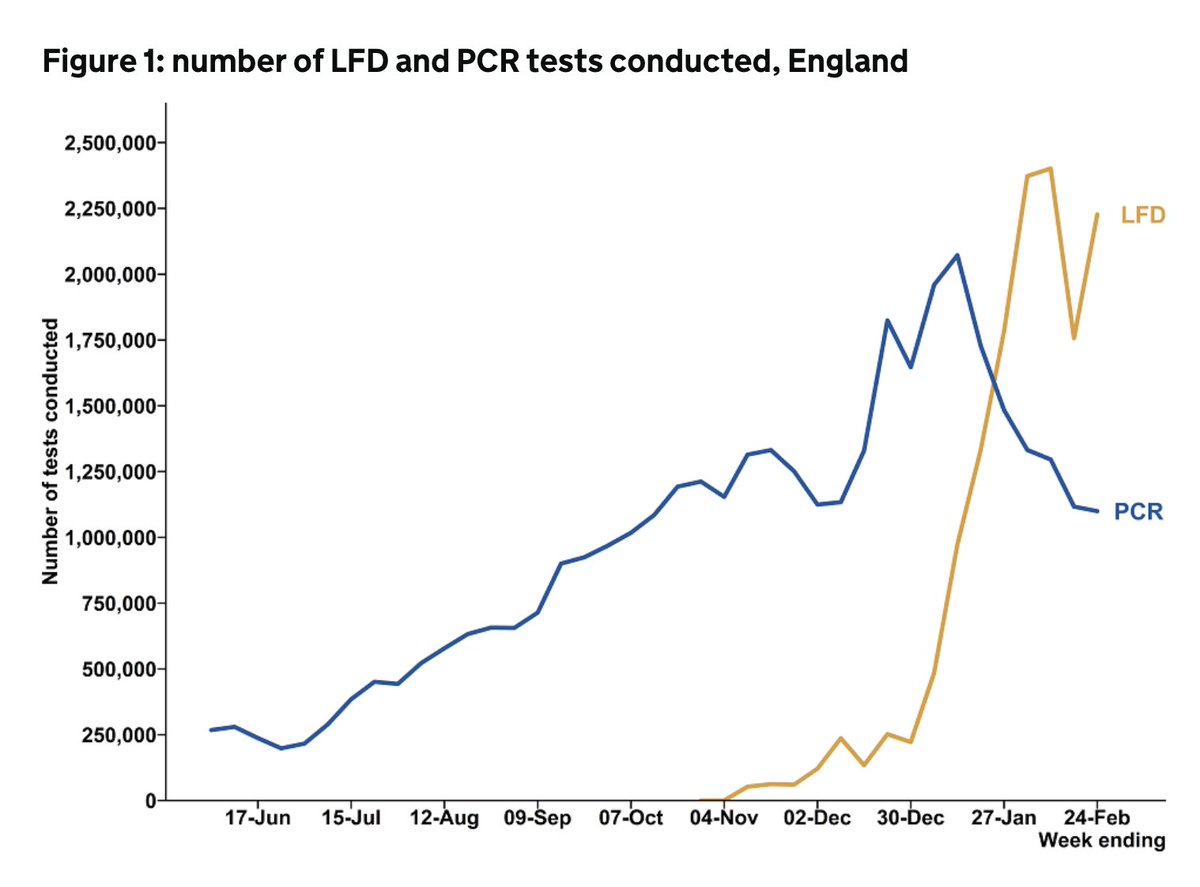
The steep drop in P2 positivity is due to the massive jump in LFD use (lateral flow devices for rapid testing among people without symptoms)
2.8m done between 1st-7th March, with a positivity of 0.17% compared with 1.7m done the week before. LFD use will rise further next wk.
2.8m done between 1st-7th March, with a positivity of 0.17% compared with 1.7m done the week before. LFD use will rise further next wk.

Case rates falling in all ages. 70-79y/os had the lowest rates for the first time last week, with further falls this week to just 20/100,000.
The highest rates are among 30-39y/os at 89/100,000
The highest rates are among 30-39y/os at 89/100,000

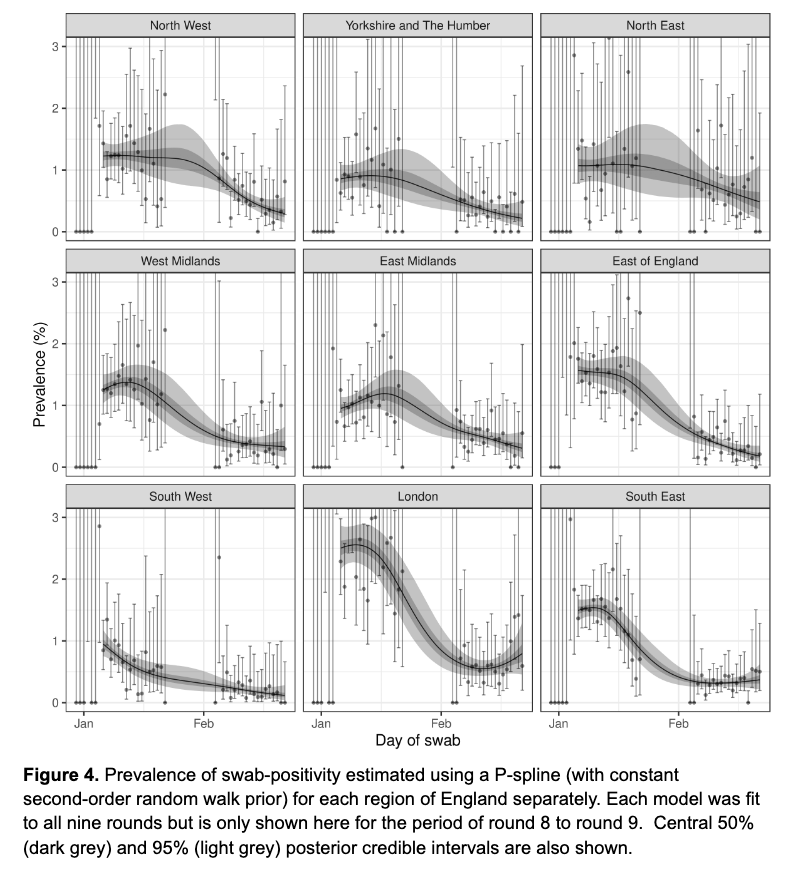
There's still variation at regional level
Yorkshire and Humber have rates at 98/100,000 compared with 32/100,000 in the SW. But the gap isn't as apparent as the last few weeks.
Yorkshire and Humber have rates at 98/100,000 compared with 32/100,000 in the SW. But the gap isn't as apparent as the last few weeks.


But there's far more variation at upper tier local authority level, with some areas of really high enduring case rates in the Midlands, NW, and NE.
The range is stark - from 151/100,000 in Hull to just 12 in Cornwall and 10 on Isle of Wight.
The range is stark - from 151/100,000 in Hull to just 12 in Cornwall and 10 on Isle of Wight.


As have spoken about before, this is more than just needing more isolation support. It requires a commitment to tackling underlying structural drivers of inequals - insecure employment, housing, deprivation - and local flexibility & resource to act.
https://twitter.com/ADMBriggs/status/1369703915399360512?s=20

Differences in infection rates by ethnicity are narrowing as case rates fall, but they still persist in some parts of the country.

In terms of incidents and outbreaks notified to PHE, great to see a drop in the number in care homes

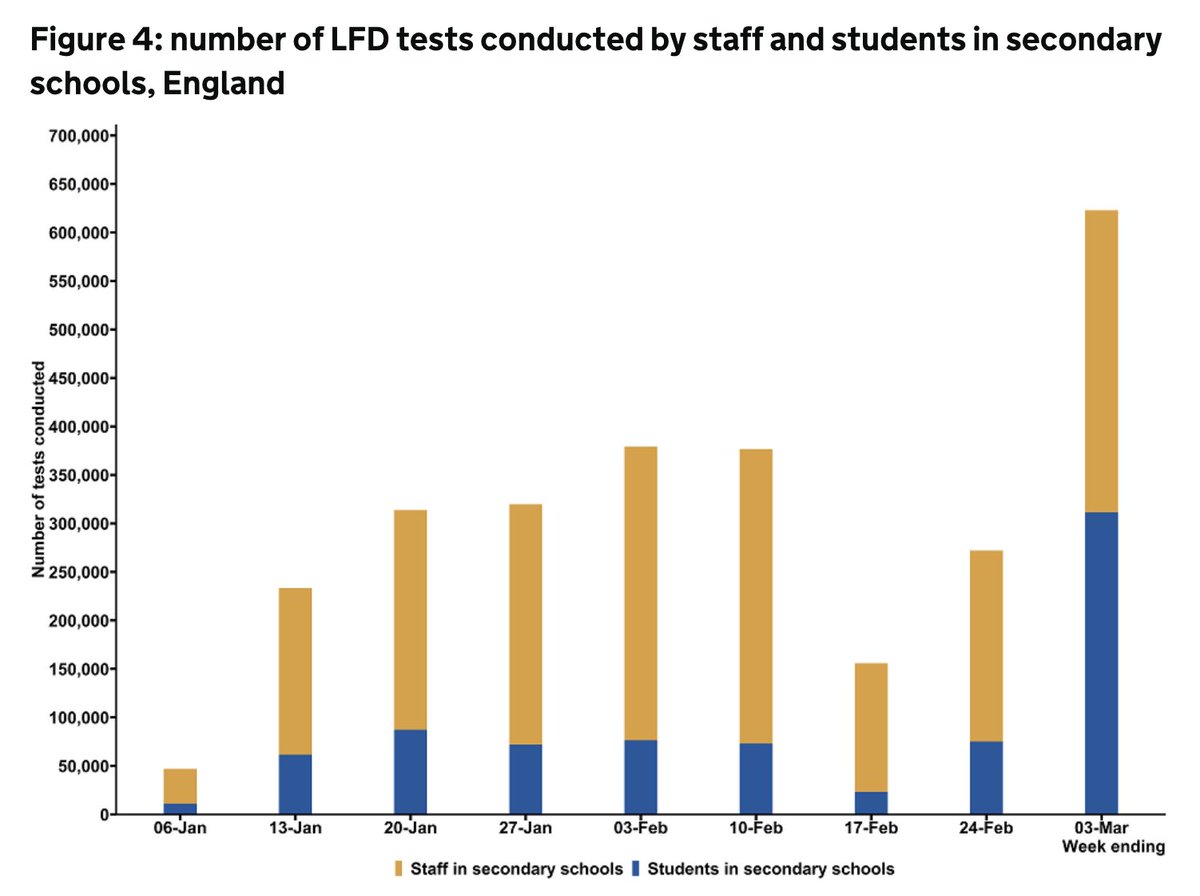
And they remain low in schools.
Although as many of you pointed out last wk - schools outbreaks are often managed by the school with support from local authority/DfE helpline rather than PHE.
So this won't reflect all outbreaks but is useful for trends, esp as students return
Although as many of you pointed out last wk - schools outbreaks are often managed by the school with support from local authority/DfE helpline rather than PHE.
So this won't reflect all outbreaks but is useful for trends, esp as students return

Reported outbreaks also remain relatively unchanged in hospitals and workplaces.


But a bit of a jump in prisons...

And onto healthcare - admission rates still falling fast everywhere (usual caveat to say the number in hospital remains about 50% of the first wave peak)


The same for ICU admissions - incl among age groups yet to be called for vaccination.
With ICU bed use also just a little under half that seen during the first wave.
With ICU bed use also just a little under half that seen during the first wave.


Number of deaths also still falling fast, and excess mortality's near baseline.
(although noting there's a delay in recent deaths being registered, there's no flu, and hugely sadly some people who may otherwise have died in the last wk will have died earlier in the yr)
(although noting there's a delay in recent deaths being registered, there's no flu, and hugely sadly some people who may otherwise have died in the last wk will have died earlier in the yr)


And finally - COVID vaccine uptake among groups called so far is really high. Over 86% for all age gps above 65yrs.
By contrast, annual flu jab uptake for over 65y/o is normally around 70%.
By contrast, annual flu jab uptake for over 65y/o is normally around 70%.

But we know there are significant inequals in the vaccine uptake by ethnicity and deprivation, so continued efforts to increase uptake even among cohorts already called remains really important.
PHE surveil rpt☝️@felly500 @deb_cohen @martinmckee @carolecadwalla @mgtmccartney @ADPHUK @Jeanelleuk
@fascinatorfun @profchrisham @petermbenglish @HPIAndyCowper @Davewwest @HSJEditor @KateAlvanley
@IndependentSage @nedwards_1 @SamanthaJonesUK @ewanbirney @FurberA @Dr_D_Robertson
@fascinatorfun @profchrisham @petermbenglish @HPIAndyCowper @Davewwest @HSJEditor @KateAlvanley
@IndependentSage @nedwards_1 @SamanthaJonesUK @ewanbirney @FurberA @Dr_D_Robertson
• • •
Missing some Tweet in this thread? You can try to
force a refresh