Sure. Have set it out below.
https://twitter.com/JenniferTHF/status/1372227737977491460
The Test & Trace budget for 2021/22 is £15bn.
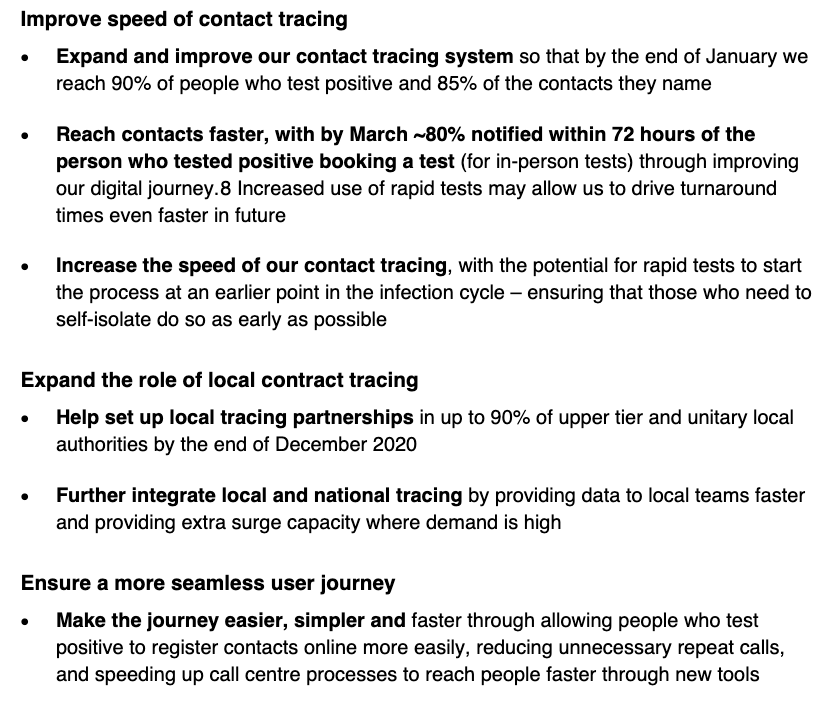
There's no specific remit letter and whilst a new strategy is awaited (see @CommonsPAC report), the most recent T&T business plan from Dec 2020 covers four key priority areas.
assets.publishing.service.gov.uk/government/upl…
There's no specific remit letter and whilst a new strategy is awaited (see @CommonsPAC report), the most recent T&T business plan from Dec 2020 covers four key priority areas.
assets.publishing.service.gov.uk/government/upl…


Unpacking these.
For 'Team of Teams' - it's a lots of local gov led programmes: community testing, local contact tracing, support for self-isolation, and local outbreak management.
For 'Team of Teams' - it's a lots of local gov led programmes: community testing, local contact tracing, support for self-isolation, and local outbreak management.


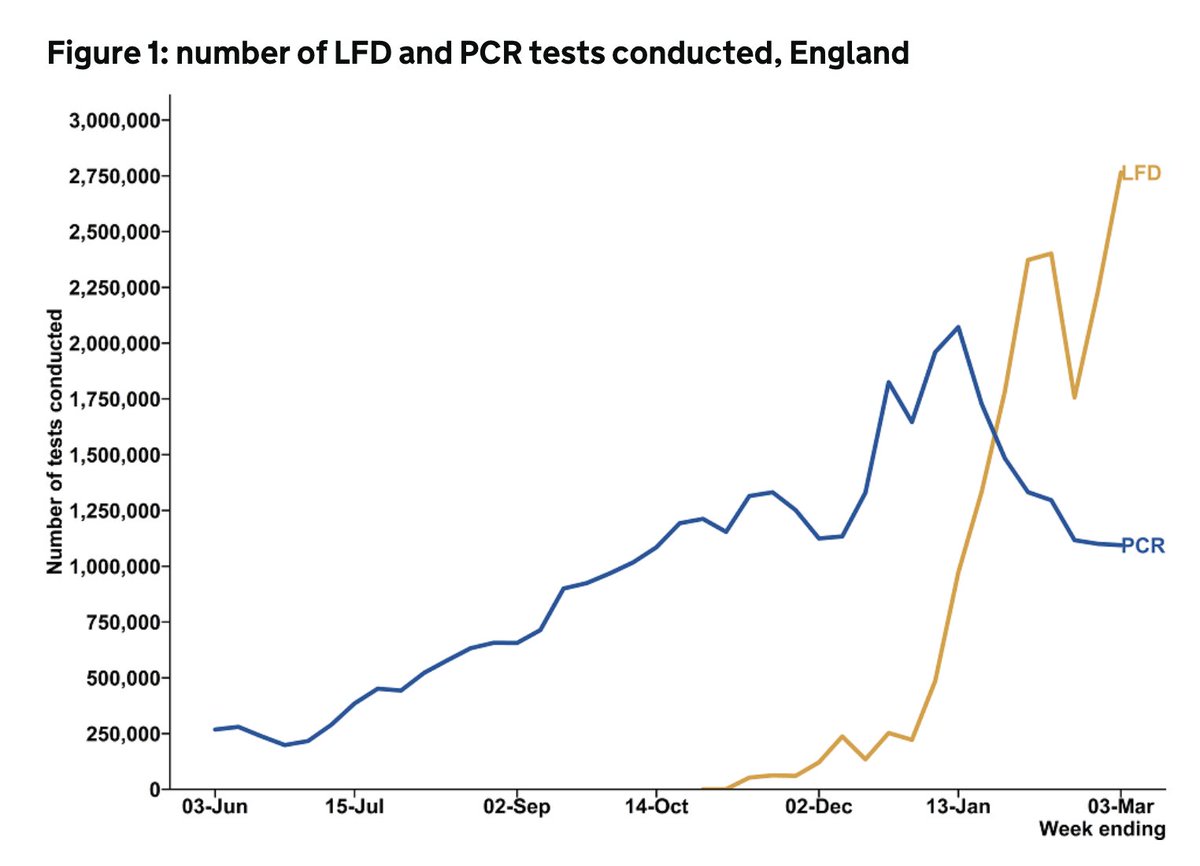
For 'increasing the speed and reach', it's lots more testing, faster contact tracing and more local contact tracing (again), and do more to understand and offer support for self isolation (again).


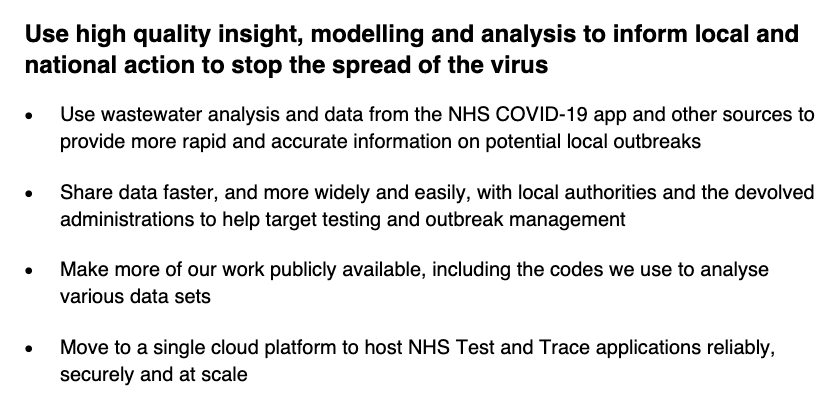
For 'improving the use of our data', it's faster data sharing with local gov, making more info public, faster outbreak identification, and the app.

And finally for 'offering an excellent service', it's better comms.


In summary - as of Dec 2020, for £15bn the intention is lots more tests, faster tracing, more support for isolation, better comms, and lots more working with local government.
Onto the public health grant. It's £3.3bn split between 152 local authorities to meet all the prescribed functions.

And then as many of the non-prescribed functions as possible based on local need and resource (note - this includes pretty core things like childhood obesity, stop smoking services, and drug and alcohol services)


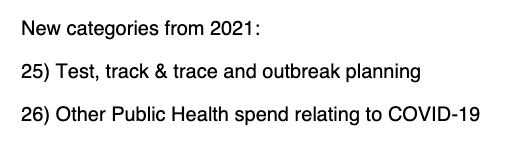
And then these two new categories for 2021.
(and as an aside the March Budget included £400m - so far for 21/22 - from the Contain Outbreak Management Fund to also support the local COVID public health response)
(and as an aside the March Budget included £400m - so far for 21/22 - from the Contain Outbreak Management Fund to also support the local COVID public health response)
So despite the devastating impact of COVID on health & inequalities, the public health grant has been cut by 24% in real term per capita since 2015/16.
Who's to know what's reasonable T&T expenditure in a pandemic, but local gov does look a little short changed.
Hope that helps
Who's to know what's reasonable T&T expenditure in a pandemic, but local gov does look a little short changed.
Hope that helps

• • •
Missing some Tweet in this thread? You can try to
force a refresh