This week's PHE surveillance report, covers 8th-14th March. 🧵
Tl,dr:
- cases falling but LFDs making it a harder to follow trends
- Still important inequalities by local authority, ethnicity, & deprivation.
- And good news on vaccines and seroprevalence
gov.uk/government/sta…
Tl,dr:
- cases falling but LFDs making it a harder to follow trends
- Still important inequalities by local authority, ethnicity, & deprivation.
- And good news on vaccines and seroprevalence
gov.uk/government/sta…
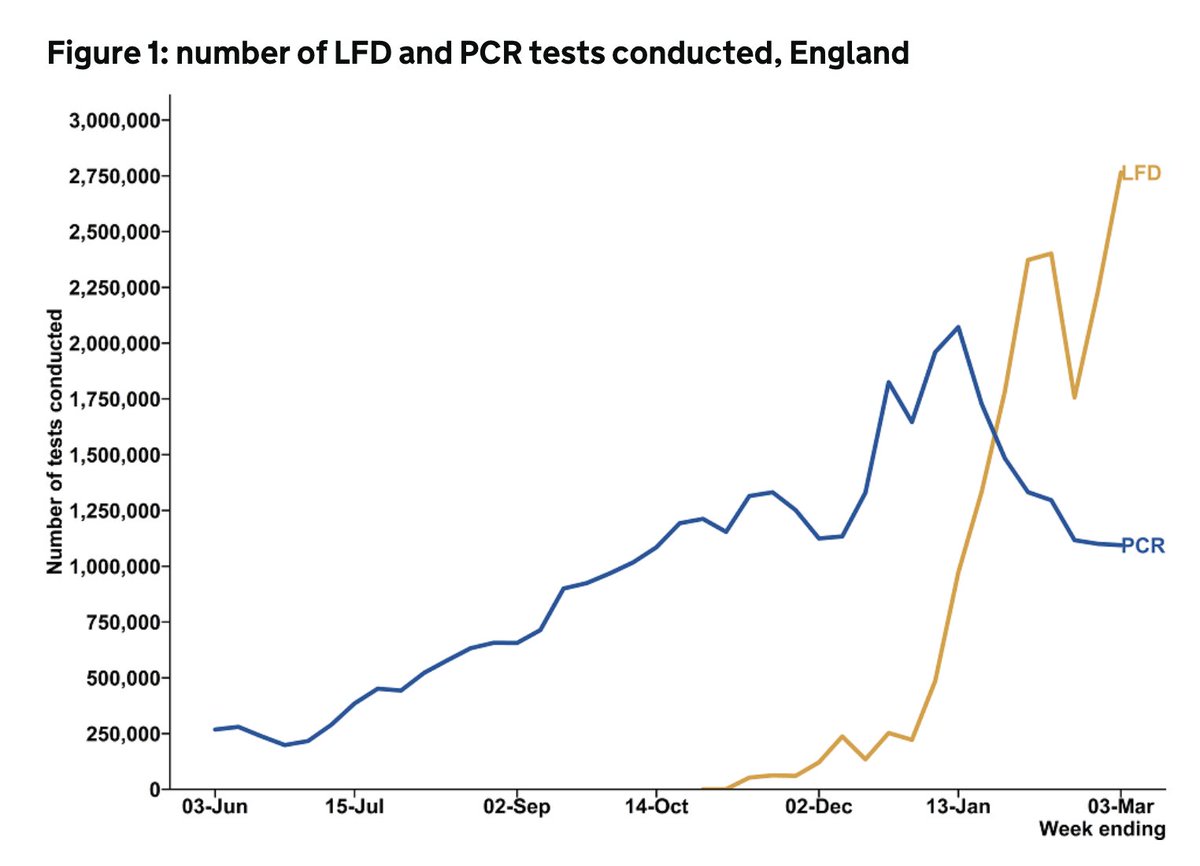
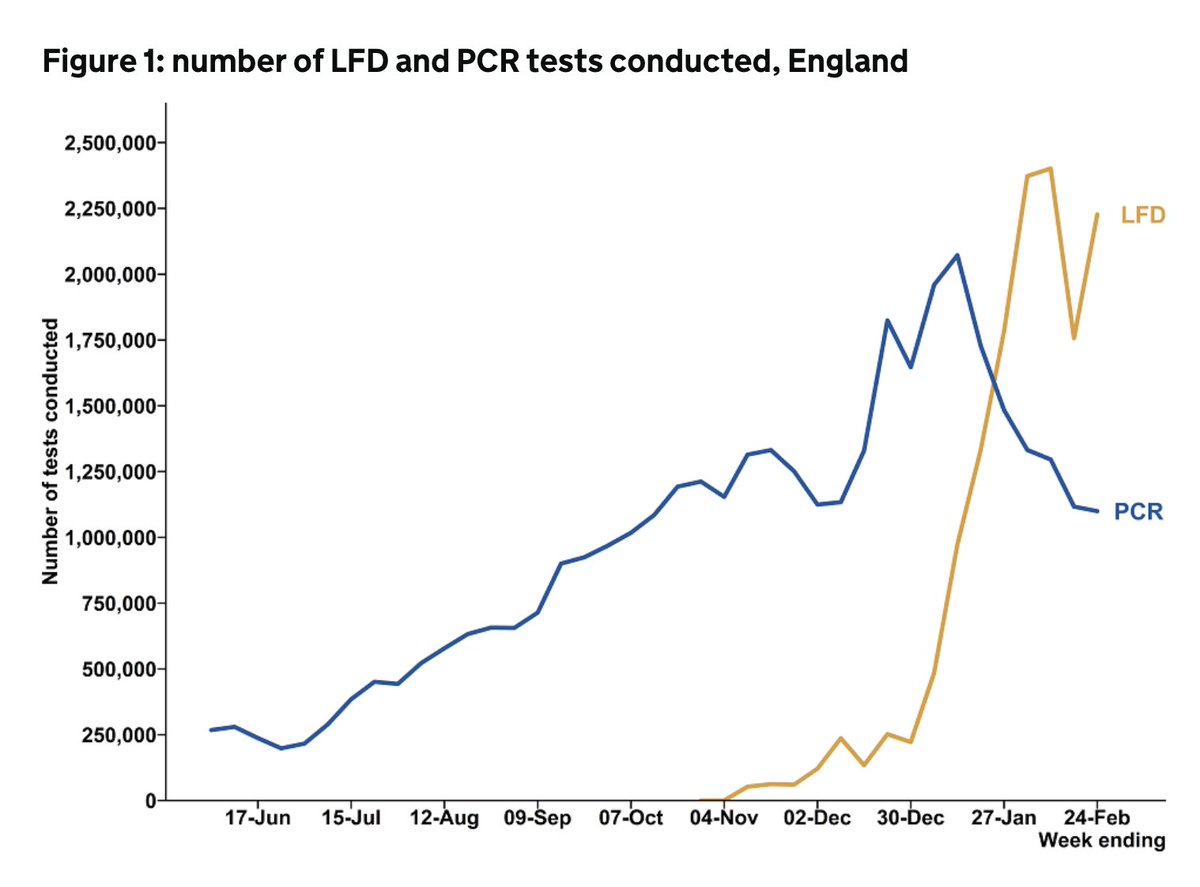
case rates continue to drop, but increasingly difficult to interpret pillar 2 data (community testing) here as it includes both lateral flow devices (LFDs) for those without symptoms, and PCR tests for those with symptoms. 

This is laid out here - LFD test use over 5m in the most recent week reported, with positivity 0.15% compared with 2.4% among PCR tests.

Some of this is teased out in the weekly test & trace data reporting, but it's not easy to infer trends in
- PCR positive symptomatic people
- LFD positive, no PCR
- LFD positive, confirmed by PCR
- LFD positive but would have gone on to get symptoms and a PCR if hadn't had LFD.
- PCR positive symptomatic people
- LFD positive, no PCR
- LFD positive, confirmed by PCR
- LFD positive but would have gone on to get symptoms and a PCR if hadn't had LFD.
From the gov.uk data dashboard, b/w 8-14th March there were 32,811 cases in Eng, down only 2% on wk before.
BUT:
- 25,899 were PCR only, ⬇️11%
- 4,406 were LFD no PCR, ⬆️47%
- 2,506 were LFD with confirmatory PCR, ⬆️62%
Therefore PCR trend is more encouraging
BUT:
- 25,899 were PCR only, ⬇️11%
- 4,406 were LFD no PCR, ⬆️47%
- 2,506 were LFD with confirmatory PCR, ⬆️62%
Therefore PCR trend is more encouraging
Case rates falling in all ages and regions.
Plus the gap between N and S in case rates is disappearing, except for a worrying step up in Yorks and Humber, who already had the highest case rates as the only region still with >100 cases/100,000.
Plus the gap between N and S in case rates is disappearing, except for a worrying step up in Yorks and Humber, who already had the highest case rates as the only region still with >100 cases/100,000.


Looking at region by age, it looks in part driven by secondary school age children and younger adults.

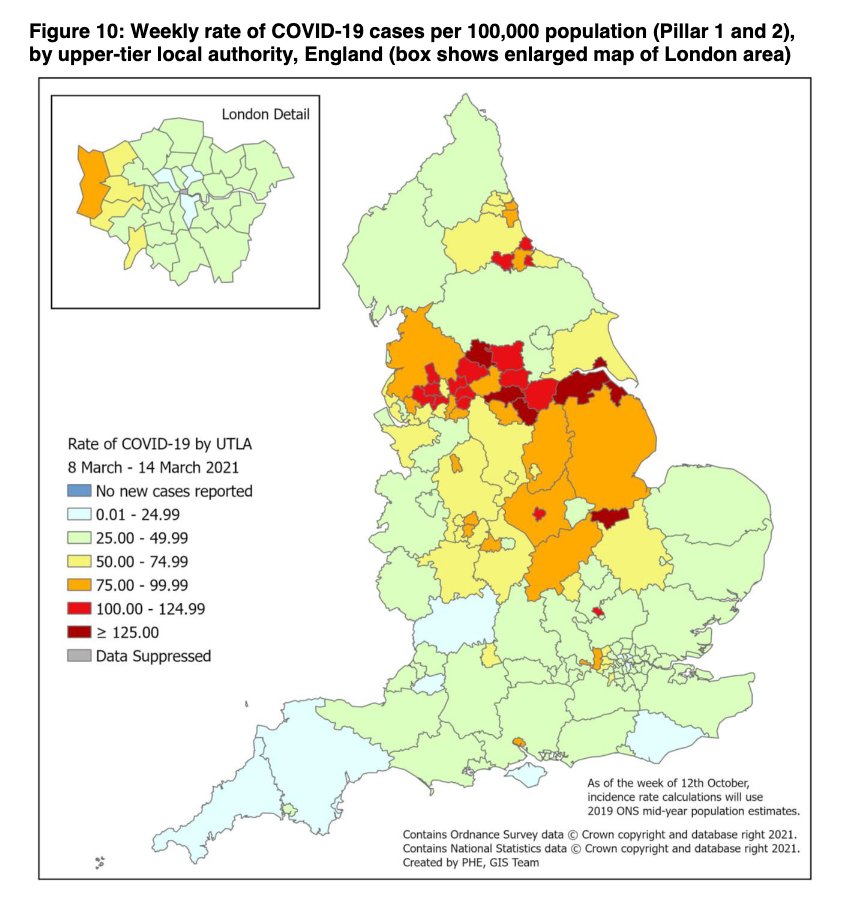
The map by local authority highlights these differences - these inequalities - more clearly.
There are many parts of the country with ongoing higher case rates. Areas often with more deprived communities, & structural drivers of inequalities like crowded housing & insecure work
There are many parts of the country with ongoing higher case rates. Areas often with more deprived communities, & structural drivers of inequalities like crowded housing & insecure work
Overall picture by ethnicity shows some ongoing differences in case rates between different ethnicities.
This is clearer in some of the regional data.
This is clearer in some of the regional data.


And differences in case rates by deprivation remains evident.
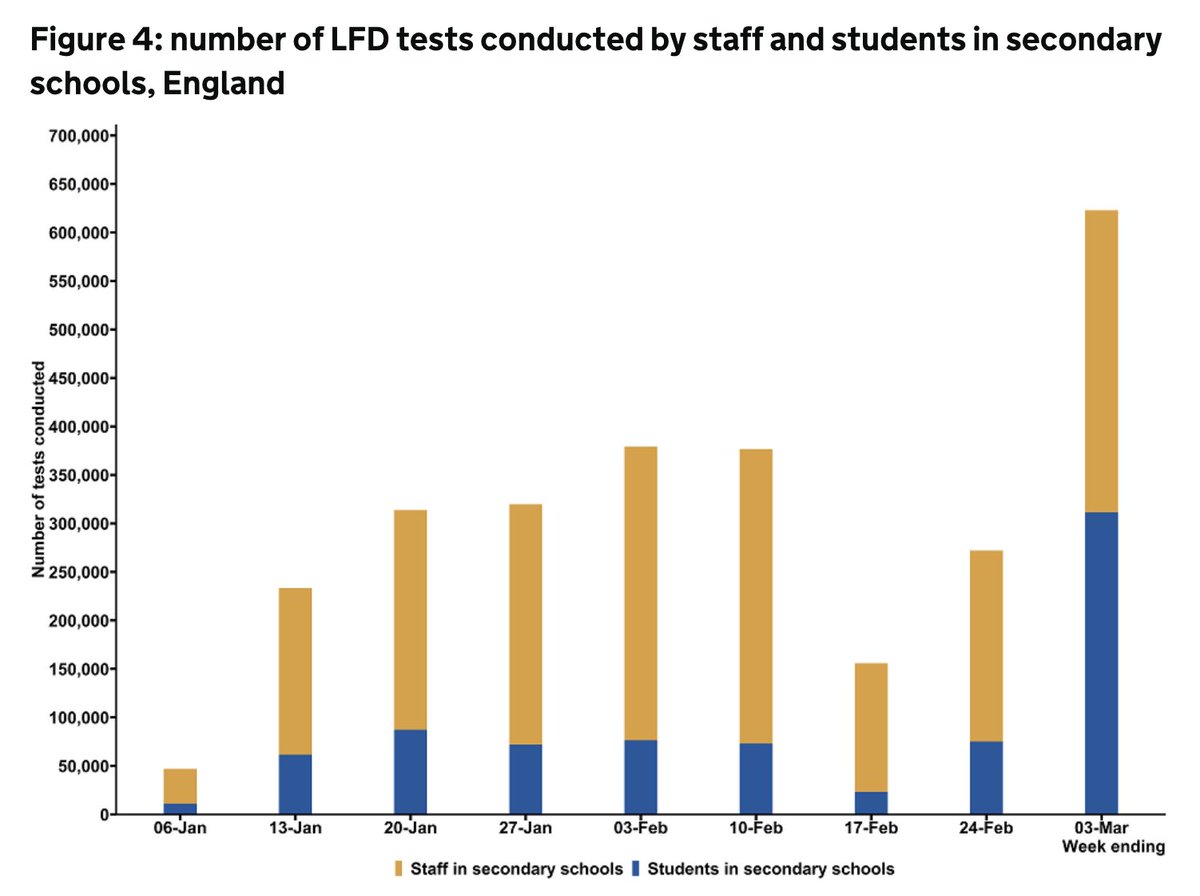
Note uptick in case rates in secondary school/college age.
Much of this will be LFD tests. Plus it's interesting (and important) to note that if anything, this is unveiling even greater inequals by deprivation.
Note uptick in case rates in secondary school/college age.
Much of this will be LFD tests. Plus it's interesting (and important) to note that if anything, this is unveiling even greater inequals by deprivation.

In terms of outbreaks/incidents reported to PHE. Really great to see (another) drop in outbreaks among care homes as well as hospitals.

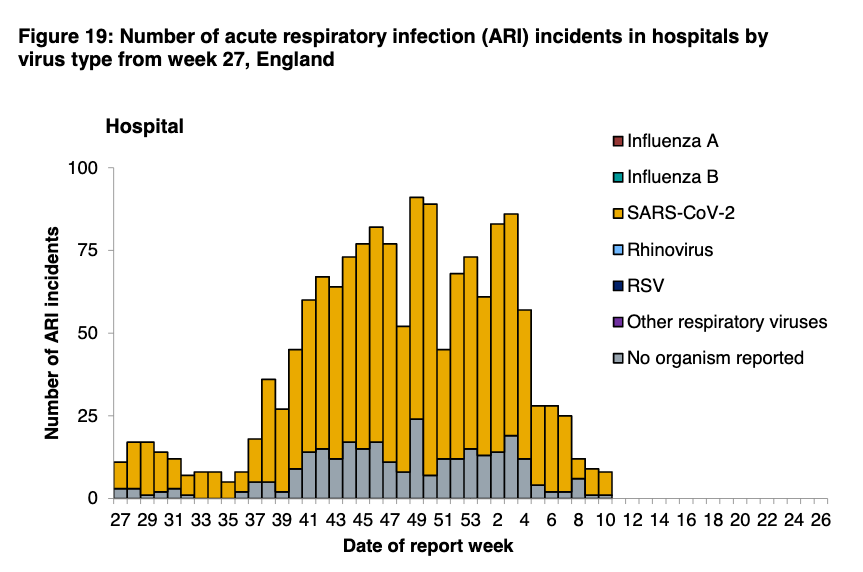
As would be expected, uptick in those reported from edu settings.
As mentioned last week, not all are reported to PHE - many are handled by local gov or DfE helplines. But trend is still important to watch.
As mentioned last week, not all are reported to PHE - many are handled by local gov or DfE helplines. But trend is still important to watch.

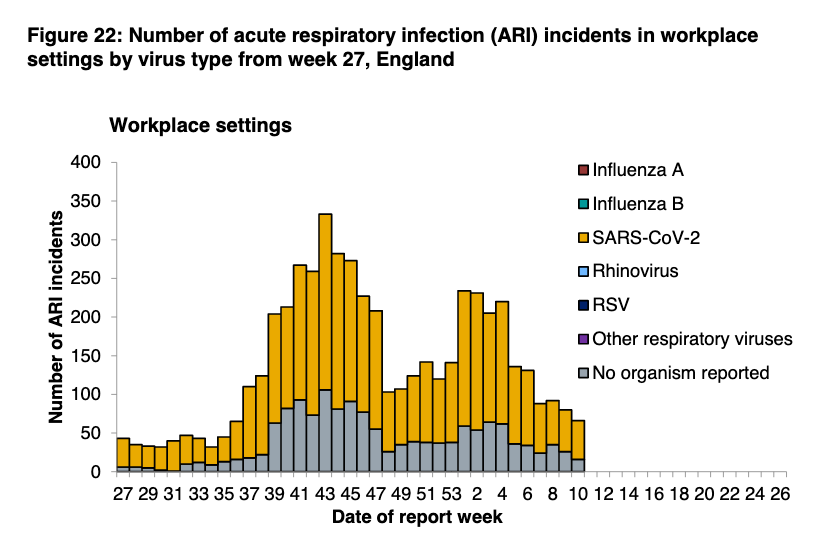
Finally, little change in reported outbreaks among workplaces.
Hospitalisations continue to fall everywhere and all ages (esp over 75yrs).
And number in hospital now at about 1/3 of the first wave peak.
And number in hospital now at about 1/3 of the first wave peak.


It's the same picture for ICU bed use. The rate of decline is slowing, but it's still going down.
Look particularly at admission rates among 65-74yr olds plummeting.
Look particularly at admission rates among 65-74yr olds plummeting.


The number of deaths also continues to fall quickly, and we may now (finally) be back to baseline, with no excess all cause mortality.


And to finish, more positive news.
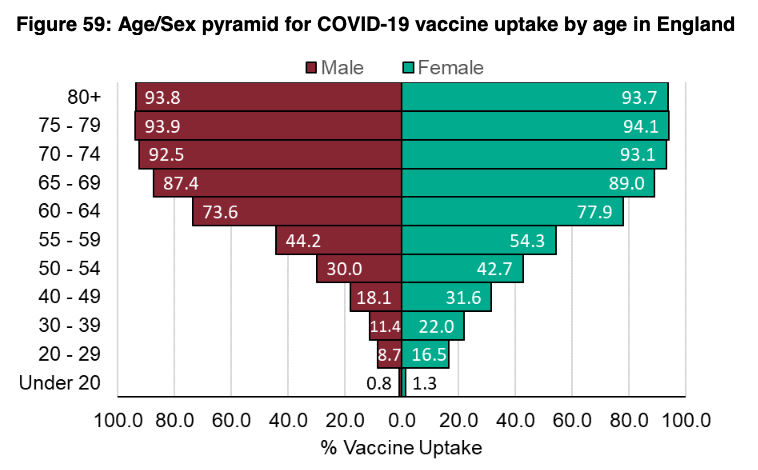
Vaccine uptake rates continue to soar. Nearly 90% coverage for all age groups over 65yrs.
Vaccine uptake rates continue to soar. Nearly 90% coverage for all age groups over 65yrs.

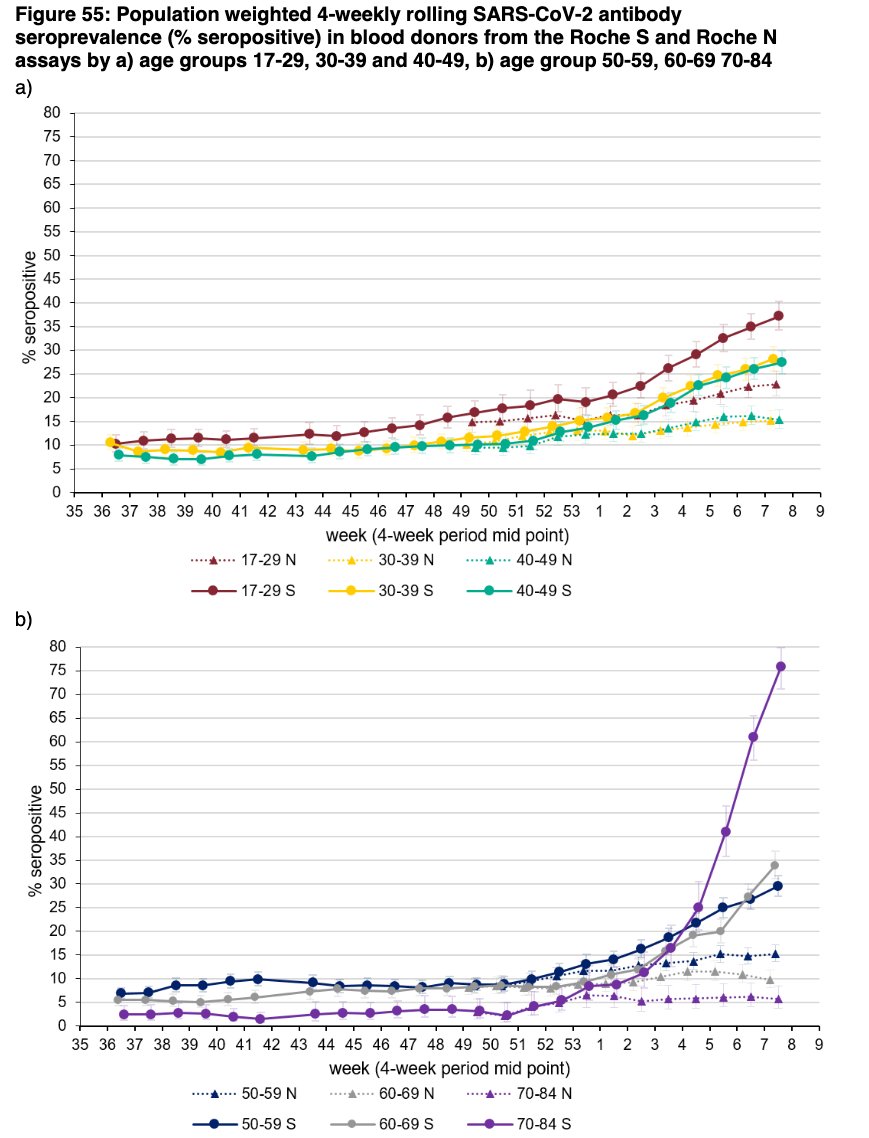
And this is translating into really heartening (and striking) seroprevalence data. Essentially, among blood donors, how many have antibodies to SARS-CoV-2.
The red line will only detect post-infection antibodies. The black line is either post-infection or post-vaccination 😁
The red line will only detect post-infection antibodies. The black line is either post-infection or post-vaccination 😁

By age, it's even more striking.
For 70-84y/os, 75% have antibodies from vaccine or infection, compared with just 5% from infection alone (purple circles and triangles on the bottom graph).
For 70-84y/os, 75% have antibodies from vaccine or infection, compared with just 5% from infection alone (purple circles and triangles on the bottom graph).
Finally, it's v important to say that those who haven't yet been vaccinated in priority groups are more likely to be from more deprived, vulnerable & minority groups.
The groups most impacted by COVID.
It's therefore critical that efforts to reach these people continue.
The groups most impacted by COVID.
It's therefore critical that efforts to reach these people continue.
(and not only does the vaccine work, it remains safe with benefits far outweighing any potential risks)
gov.uk/government/new…
gov.uk/government/new…
PHE surveil rpt☝️@felly500 @deb_cohen @martinmckee @carolecadwalla @mgtmccartney @ADPHUK @Jeanelleuk @fascinatorfun @profchrisham @petermbenglish @HPIAndyCowper @Davewwest
@HSJEditor @KateAlvanley @IndependentSage
@nedwards_1 @SamanthaJonesUK @ewanbirney
@FurberA @Dr_D_Robertson
@HSJEditor @KateAlvanley @IndependentSage
@nedwards_1 @SamanthaJonesUK @ewanbirney
@FurberA @Dr_D_Robertson
• • •
Missing some Tweet in this thread? You can try to
force a refresh