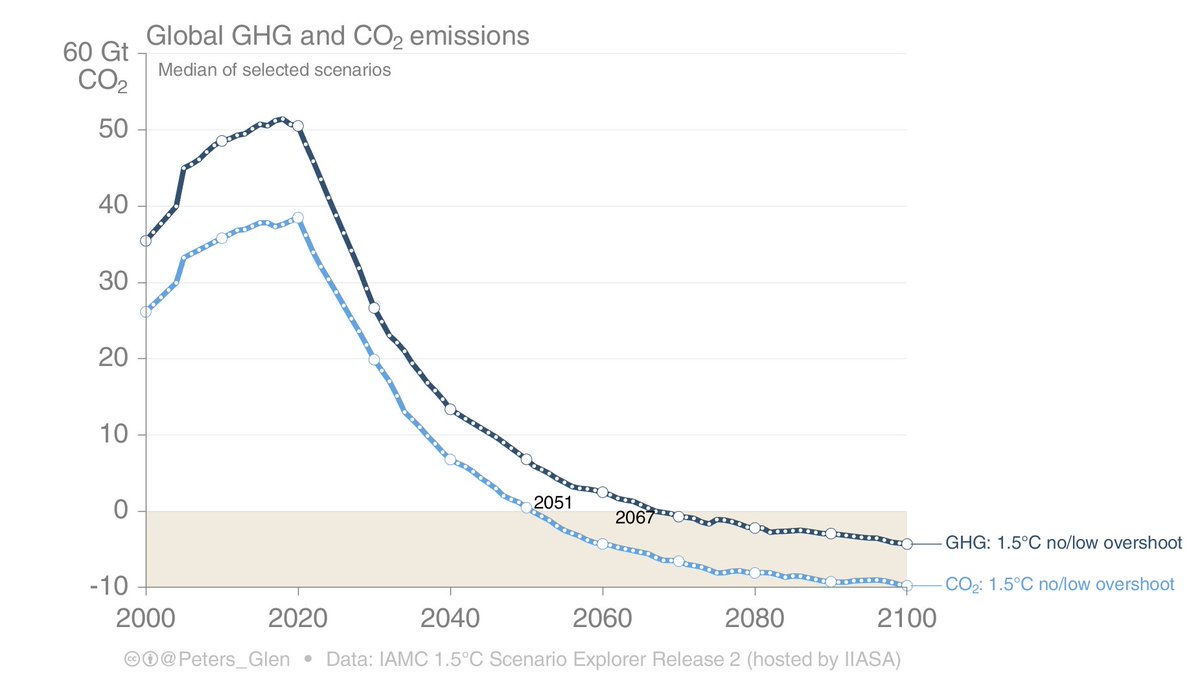
Historically, the land & ocean sink have removed about one-half of the anthropogenic CO₂ emissions.

If we mitigate successfully in the future, the sinks will take up less CO₂ since emissions are lower, but they will be replaced by 'engineered sinks'.

1/n
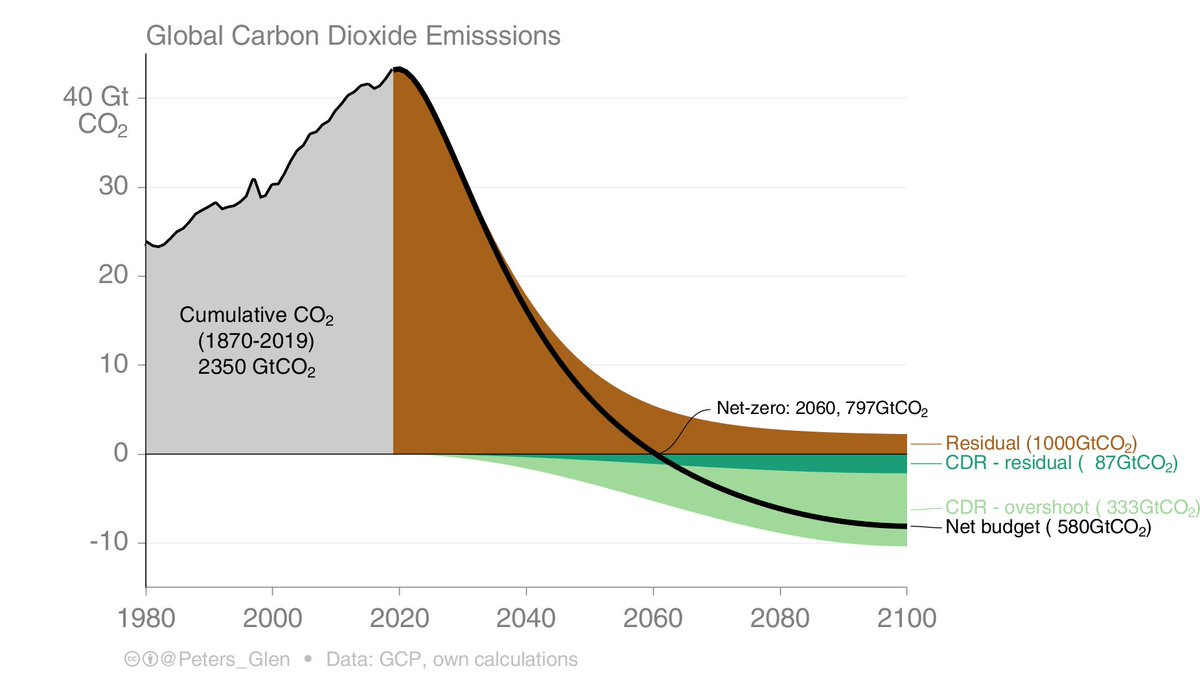
This is a more detailed figure showing the anthropogenic CO₂ emission sources (top), & the land and ocean sinks (with the balance remaining in the atmosphere). Bread & butter carbon cycle...

2/
globalcarbonproject.org/carbonbudget/i…
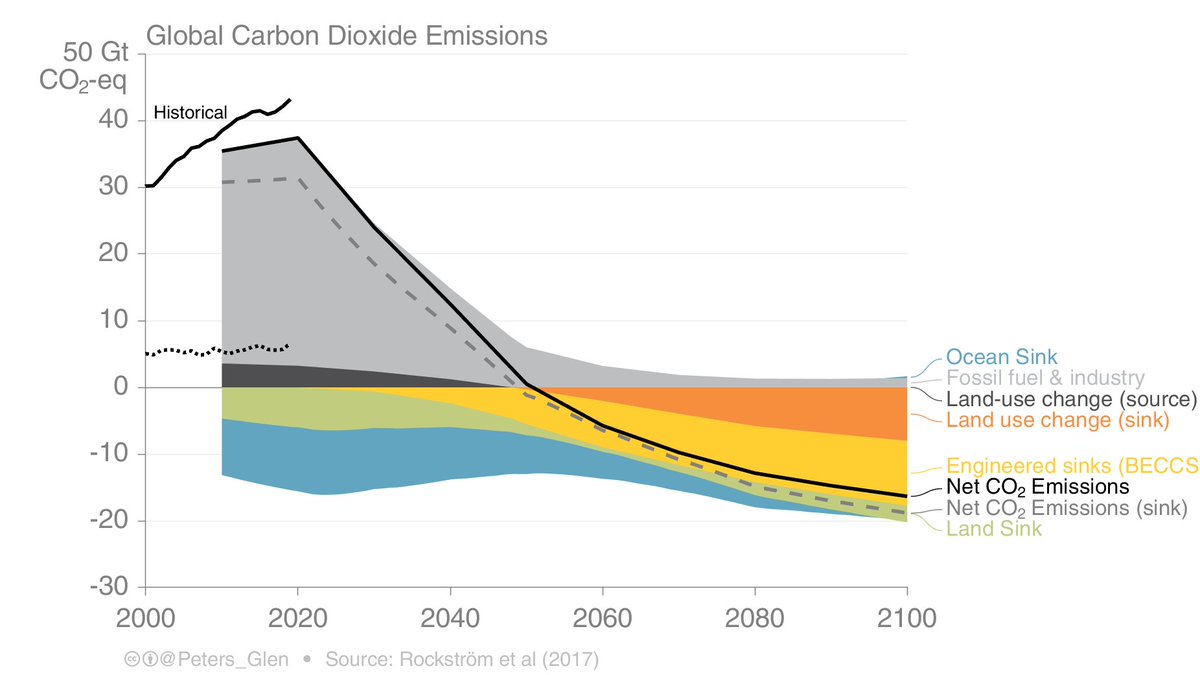
As we mitigate, the land & ocean sinks take up less, but engineered sinks (eg BECCS) & afforestation increase.

If the land sink is included as an emissions source, then emissions still need to go to zero about the same time (dashed line).

Fig based on science.sciencemag.org/content/355/63…
3/
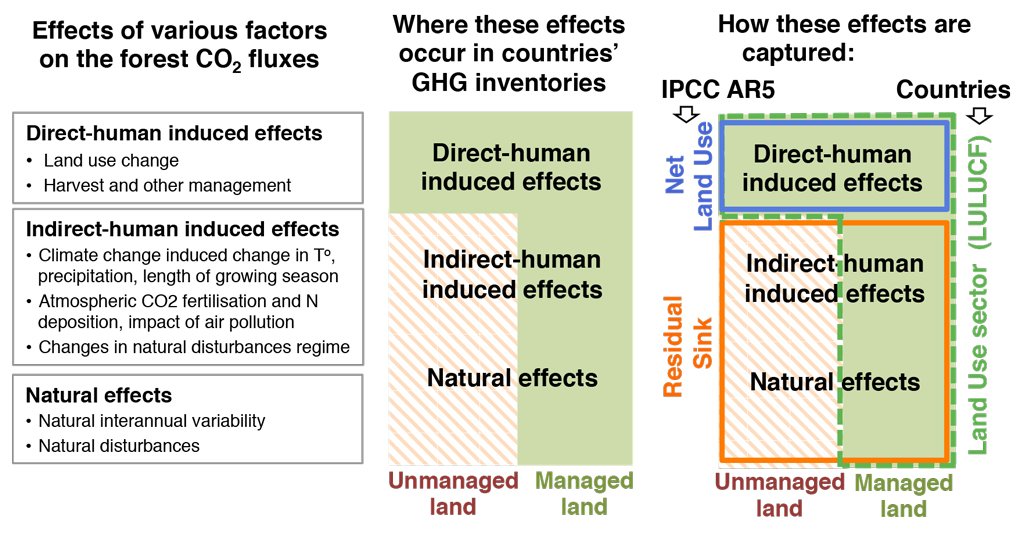
Why would one add land sinks to emissions? As an experiment!

UNFCCC inventories do partially include some 'natural' sinks in as anthropogenic emissions (green in right panel). The figures above take anthropogenic as the blue box.

4/

carbonbrief.org/guest-post-cre…
These differences are not minor...

Net land-use emissions based on scientific studies (blue) are about 4GtCO₂ higher than those based on UNFCCC inventory definitions (green)...

5/

More details:
rdcu.be/bHT2p
Some countries / regions are starting to include the UNFCCC land-sink in their emission targets (NDCs), such as the EU27.

This makes net-zero much easier. It may be ok, but it is on a slippery slope of definitions...

Sweden, eg, will almost be at net-zero if including sinks

6/
What would happen if we said 'bugger it' & let countries allocate their entire land-sink to anthropogenic emissions?

Some would get a short-term boost, but if mitigation happens, the sink vanishes. It may even make mitigation harder as it is necessary to protect the sink.

7/
Back to the original figure, some will note the obvious inconsistencies in historical emissions & land-sink.

The future sink is based on MAGICC, & would require digging into weeds to understand if there is an inconsistency with history. I will ignore for now!

8/
How to incorporate the 'land sink' into climate targets is going to be a big discussion in the years ahead.

Countries will be finding whatever way to become net-zero. But, since the sink declines with mitigation, it may not matter?

This thread is just a background...

/end

• • •

Missing some Tweet in this thread? You can try to force a refresh
 

Keep Current with Glen Peters

Glen Peters Profile picture

Stay in touch and get notified when new unrolls are available from this author!

Read all threads

This Thread may be Removed Anytime!

PDF

Twitter may remove this content at anytime! Save it as PDF for later use!

Try unrolling a thread yourself!

how to unroll video
  1. Follow @ThreadReaderApp to mention us!

  2. From a Twitter thread mention us with a keyword "unroll"
@threadreaderapp unroll

Practice here first or read more on our help page!

More from @Peters_Glen

19 Mar
IPCC: "In model pathways with no or limited overshoot of 1.5°C, global net anthropogenic CO₂ emissions [reach] net zero ~2050 (2045–2055)"

There are likely equally plausible scenarios (shown here) that reach net-zero CO₂ emissions in 2100 with the same 'carbon budget'.

1/
You don't believe me?

These are the scenarios used for net-zero ~2050 (2045-2055). They basically all cross zero around 2050. This is because they focus on 2100 targets & allow 'overshoot'.

This is a design feature of the scenarios, & are not the only way to get to 1.5°C!

2/
The temperature response to those scenarios all have a 'peak & decline' shape. Some of the 'peak & decline' is due to CO₂ emissions & some to non-CO₂ emissions (GWP100 confuses this point).

Most modelling uses a 2100 target, allowing overshoot (a cost-effective 'feature').

3/
Read 4 tweets
18 Mar
THREAD: Net-zero emissions

What is the the different between zero & net-zero? CO₂ or GHG?

Does net-zero mean emissions continue but are offset by Carbon Dioxide Removal (CDR)? (no)

Based on a presentation: slideshare.net/GlenPeters_CIC…
2. First, why is "net-zero" needed in the first place?

Science shows that the temperature stops rising when CO₂ emissions reach (net-)zero.

There are non-CO₂ emissions, but they have a smaller (secondary) effect & declining emissions may be sufficient

cicero.oslo.no/no/posts/klima…
3. Zero emissions:

If we take a remaining carbon budget consistent with 1.5°C, then emissions need to drop rapidly. This curve converges to zero, there is no physical reason to have a straight line to zero.

(I took 580GtCO₂ from SR15 Table 2.2, not adjusted for time past)
Read 14 tweets
17 Mar
What is net-zero? Is it carbon neutral? CO₂ or GHG?

Did you know that 1.5°C scenarios reach net-zero CO₂ emissions around 2050, but net-zero GHG emissions around 2070?

1/
For a likely below 2°C scenario, the net-zero years are shifted back about 20 years.

In fact, many likely below 2°C scenarios don't require net-zero GHG emissions until after 2100.

2/
And why "net" and not just zero?

That is because it is hard to get all emissions completely to zero, & so some carbon dioxide removal is needed to clean up any remaining emissions.

The scale is important. How much CDR is possible?

3/
Read 6 tweets
16 Mar
IPCC AR5 WG3 (2014) had a figure showing the impact on mitigation costs of various technology restrictions (eg, no CCS).

It also compared lower energy demand (20–30% below baseline by 2050 & 35–45 % by 2100), first set of bars.

This 𝑟𝑒𝑑𝑢𝑐𝑒𝑑 mitigation costs by half.

1/
The 'low energy demand' analysis enforced a reduction on demand, but did not evaluate the costs (ie, mitigation costs of reduced demand are assumed zero).

This is the same as in newer studies
* LED: nature.com/articles/s4156…
* Alternative pathways: nature.com/articles/s4155…

2/
The (infamous) 'Low Energy Demand' scenario essentially combines two components, 'low energy demand' & 'no CCS'.

It also does really detailed analysis on the demand side, not just an arbitrary reduction (which is good).

nature.com/articles/s4156…

3/
Read 10 tweets
13 Mar
A new estimate of fossil CO₂ emissions in 2020 from @Carbon_Monitor, showing a decline in the full year of 5.4% (1900MtCO₂).

The dip was largest in the first COVID19 wave in ~April, but at the end of 2020, monthly emissions were similar to 2019.

1/

arxiv.org/abs/2103.02526
The analysis covers all major emitters
* China the only major nation with grow (+0.5%), with end-of-year monthly emissions exciting 2019 levels
* USA: Down 9.4%
* EU27+UK: Down 7.5%
* India: Down 8.1%

The COVID declines build on top of preexisting trends.

2/
Transport was the major driver of change:
* Ground transport was 37% of the decline
* International transport was 28%, despite representing 2-3% of global emissions

The power sector was 18% of the decline, but monthly emissions are already back to 2019 levels (globally).

3/
Read 5 tweets
4 Mar
THREAD: Is this time different?

Over 10 years ago we had the Global Financial Crisis (GFC), we discussed recovery funds & rebounds at length.

But 10 years later, the context is different. Pre-COVID growth in global CO₂ emissions was slowing…

nature.com/articles/s4155…
2. The GFC came after 10 years of strong growth. There was a 𝐦𝐚𝐬𝐬𝐢𝐯𝐞 5% rebound in 2010…

Then from around 2012 emissions growth started to slow. Could this GFC recovery funds, GFC after effects, climate policy working, ...? (we don't know)

rdcu.be/bOUaB
3. Comparing 2011-2015 with 2016-2019 (global stocktake), CO₂ emissions have
* Declined in 64 countries: -0.16GtCO₂/yr
* Increased in the remainder: 0.37GtCO₂/yr
* Net increase: 0.21GtCO₂/yr

But emission reductions need to ramp up to 1-2GtCO₂/yr 𝐞𝐯𝐞𝐫𝐲 𝐲𝐞𝐚𝐫...
Read 12 tweets

Did Thread Reader help you today?

Support us! We are indie developers!


This site is made by just two indie developers on a laptop doing marketing, support and development! Read more about the story.

Become a Premium Member ($3/month or $30/year) and get exclusive features!

Become Premium

Too expensive? Make a small donation by buying us coffee ($5) or help with server cost ($10)

Donate via Paypal Become our Patreon

Thank you for your support!

Follow Us on Twitter!