Since it’s a year on from lockdown and the second wave of excess mortality now seems to be over, a few datapoints on #COVID19 mortality in the UK.
Starting with this: we’re now at 149k deaths according to the @ONS measure (deaths where COVID mentioned on certificate)
Important to note this isn’t the only measure though: excess deaths, which is deaths from ALL causes vs 5yr historical average, puts the toll at 123k. We’ll get to why there’s a big difference in a moment. Even so: however you measure it we’re talking about high numbers of deaths
Strikingly, on the basis of the most comprehensive @ONS #COVID19 figures, total #COVID19 deaths (149k in total). The second wave was far bigger than the first wave. 91k in the latest wave vs 58k in the first.
Important to note a few provisos:
1. Second wave lasted slightly longer than first.
2. Actually in some senses it wasn’t a single wave: there was the autumn wave and then an Xmas/NYE surge prob connected with the new variant. So in a sense it was two waves in one
If you look specifically at excess deaths, the mortality from the first wave outweighed the second wave (for the time being). Why? In large part fewer people dying of other causes in second wave. Poss some would have died of something else if they hadn’t been killed by #COVID19
Inevitably the question will resurface: how does the UK’s pandemic mortality compare with other countries? Is it the worst in the world? Short answer: no, but it’s AMONG the worst in the world. Longer answer: it depends on which series you look at. This is official COVID deaths
But not all countries are declaring #COVID19 deaths as judiciously as the UK and most developed countries. Look at excess deaths - perhaps a better metric - and suddenly Peru and Russia top this depressing leaderboard. UK in 16th place. Not that that’s a “good” result

• • •

Missing some Tweet in this thread? You can try to force a refresh
 

Keep Current with Ed Conway

Ed Conway Profile picture

Stay in touch and get notified when new unrolls are available from this author!

Read all threads

This Thread may be Removed Anytime!

PDF

Twitter may remove this content at anytime! Save it as PDF for later use!

Try unrolling a thread yourself!

how to unroll video
  1. Follow @ThreadReaderApp to mention us!

  2. From a Twitter thread mention us with a keyword "unroll"
@threadreaderapp unroll

Practice here first or read more on our help page!

More from @EdConwaySky

21 Mar
Something to ponder as you fill in the census. We’re currently in the midst of the most dramatic fall in the UK population since 1941, as three forces collide to push down the number of people living in this country news.sky.com/story/the-thre…
Incidentally a few people have understandably asked whether the fall in migrants last year might have been a Brexit effect. But while this might have contributed at the margin it doesn’t seem to be the main explanation. Anyway, the exodus was both EU and non-EU workers
That last chart is from this piece migrationobservatory.ox.ac.uk/resources/comm…. The phenomenon of enormous migrant outflows was first pointed out by @StrongerInNos and @jdportes ukandeu.ac.uk/estimating-the…
Read 5 tweets
19 Mar
One year on, how big a deal was the furlough scheme? Short answer: a v v v big deal.
I think we sometimes underplay this.
It has pervaded our lives in a way few if any other economic policies have and had all sorts of unintended consequences - good & bad. thetimes.co.uk/article/d724c3…
Comparable data on this isn’t especially easy to come by but the last time the @OECD had a look (turn of the year), UK had more people on furlough than any other country. Think about that for a second. And note we didn’t have either the most cases or toughest lockdown back then
When you think about it it’s pretty remarkable. Britain was unusual in Europe in not having a job retention programme (short time working) before #COVID19. But the generosity of the furlough scheme, and the enthusiasm with which it was taken up exceeded most of Europe.
Read 9 tweets
9 Feb
New: according to the @ONS the total UK #COVID19 death toll has now surpassed 125k.
Was 126,023 as of 29 Jan.
Note these are deaths where #COVID19 was mentioned on the certificate. Of those deaths, around 91% were caused by #COVID19, according to the @ONS.
Another way of calculating the death toll is excess deaths, which is deaths from all causes vs the five year average.
This was 111,540 across the UK between March 2020 and late Jan 2021.
Total deaths from all causes in week 4 of 2020 (the latest week) were higher than in the corresponding week of ANY year going back to 1970.
That’s still true even after adjusting for population.
31 deaths per 100k in week 4
Previous worst week 4: 28 per 100k in 1985
Read 5 tweets
22 Jan
I’m dearly hoping govt releases some actual data on the lethality of the new variant.
Holding a press conference to announce this ominous news alongside vague caveats about uncertainty is not a functional way to share this news
Nor was leaking it to journalists ahead of the event
There’s an irony here: @uksciencechief just told us to be a bit wary of the reports coming out of Israel warning abt the efficacy of single dose #COVID19 vaccines.
Why? Because of a lack of data.
Yet here he is making equally significant claims without providing the data.
Argh!
This episode underlines a deeper problem: a culture of data secrecy in Whitehall & NHS.
There are vast datasets that are never publicly released. Sometimes secrecy is justified to protect privacy.
Rest of the time there’s no justification for it.
This is public data. OUR data.
Read 7 tweets
22 Jan
Here's a short story about numbers, #COVID19, the scientific process and the misuse of science. And how it affects all of our lives. But it begins with these blokes, sitting in a wood-panelled room in the heart of the City of London. These are the men who decided the "gold fix".
For nearly a century the gold price was set in London in the room in a building on St Swithin's Lane. Twice a day the five men would meet in that room, call their trading rooms and, between them, settle on the price of the precious metal lbma.org.uk/assets/blog/al…
There's a long tradition of seemingly definitive numbers actually being decided in backroom meetings. Another example: LIBOR, product of a bankers' conference call (u know how that story ended).

Lesson: Most ppl pay attention to the number.
Far fewer to the process of forming it
Read 26 tweets
15 Jan
My @thetimes column about the most important economic issue no-one is talking about: the collapsing fertility rate. Not long ago the UK had one of the highest fertility rates in Europe. Not any more. This could have ENORMOUS consequences... thetimes.co.uk/article/bed703…
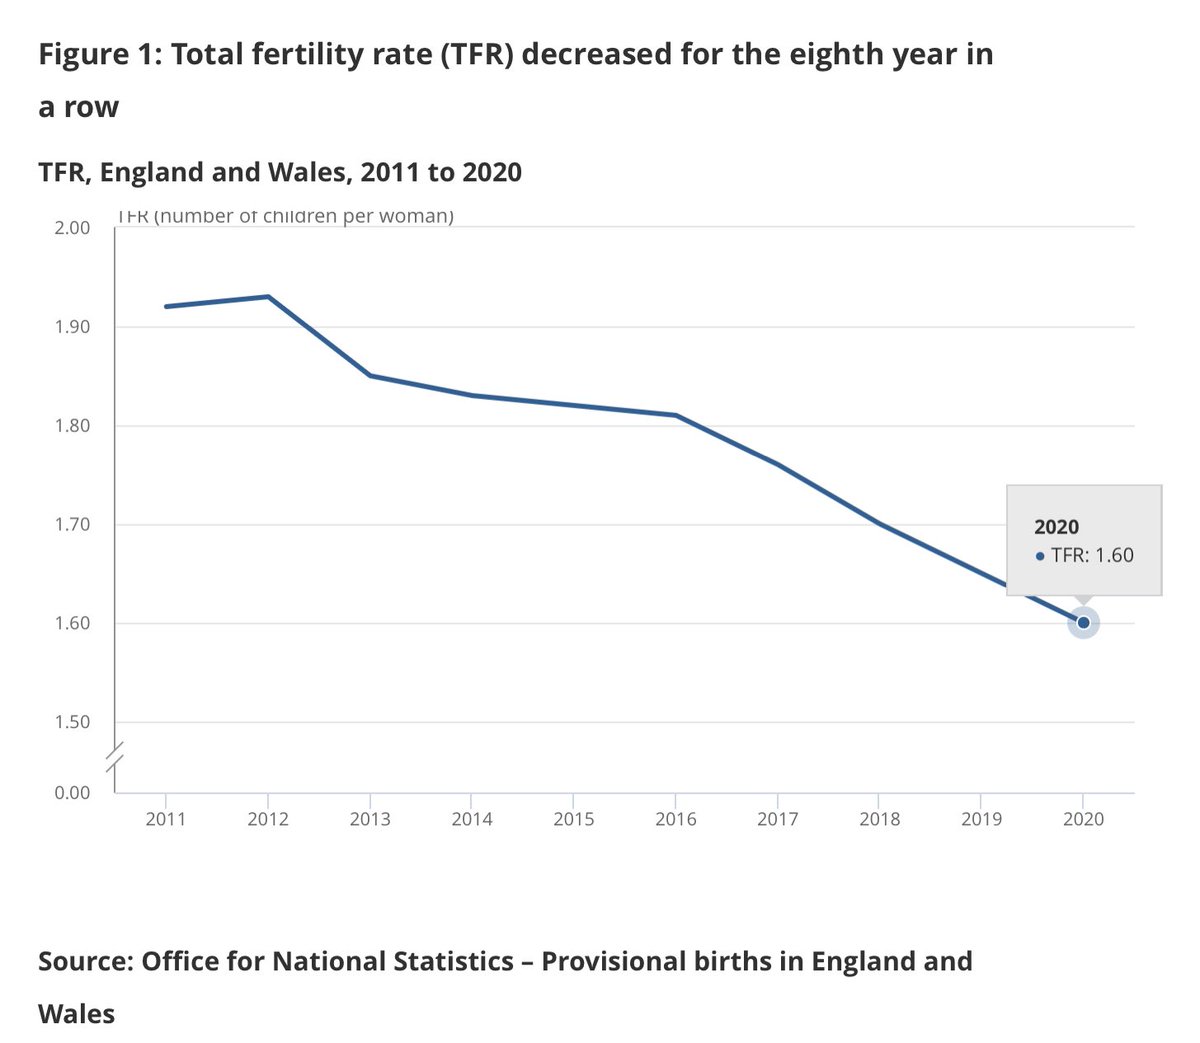
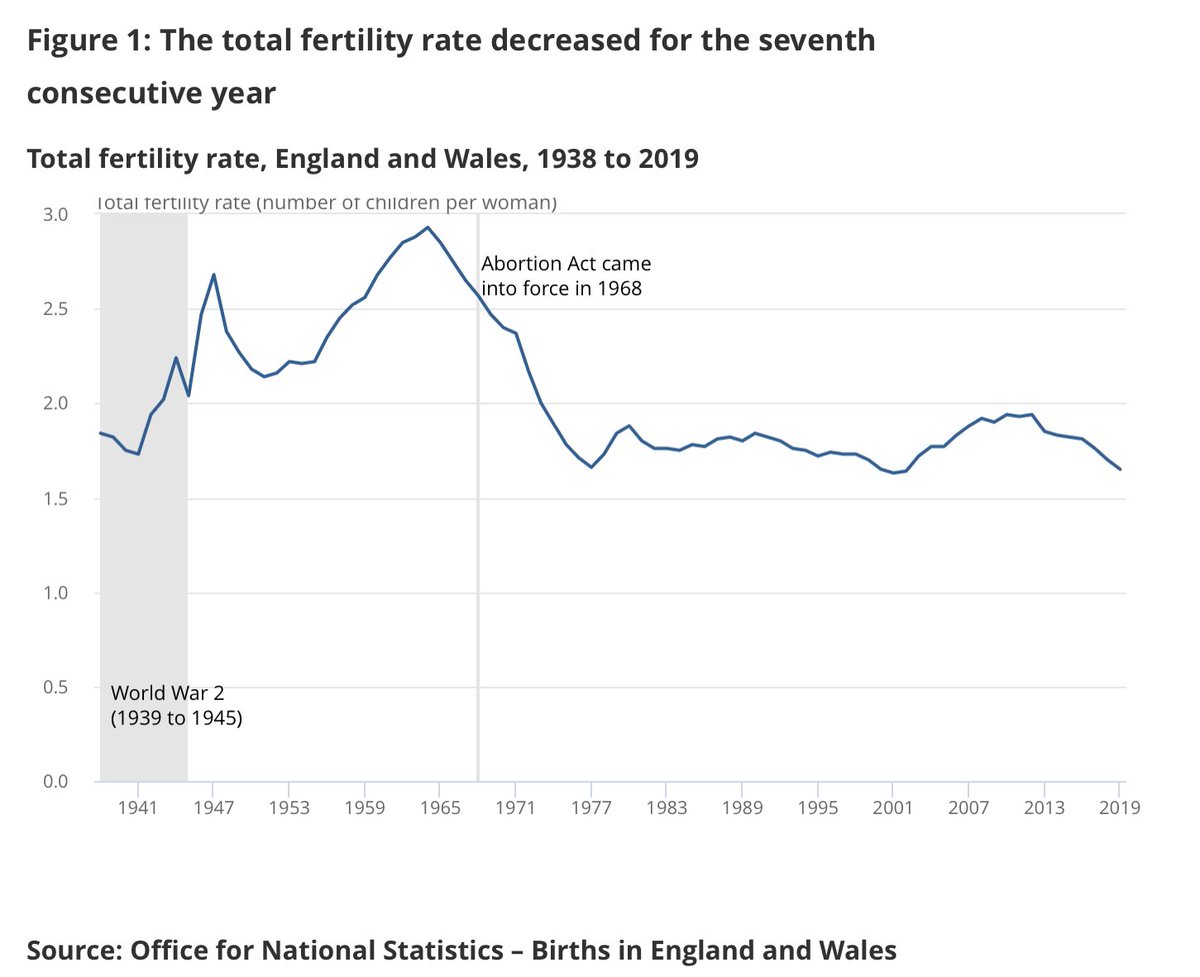
These two @ONS charts tell you the story. Up until 2012 the total fertility rate (eg no of children per woman on avg) was just under 2. By late 2020 it was 1.6. It has NEVER been that low. This pre-dates #COVID19. It is a trend. But one which v few seem to have taken on board.
Sidenote: it’s quite plausible that 2020 is the first year since the 1970s (and one of the only on record) that deaths outnumber births in England & Wales. We won’t know for a bit but both look like being just over 600k. Depressing milestone.
Read 12 tweets

Did Thread Reader help you today?

Support us! We are indie developers!


This site is made by just two indie developers on a laptop doing marketing, support and development! Read more about the story.

Become a Premium Member ($3/month or $30/year) and get exclusive features!

Become Premium

Too expensive? Make a small donation by buying us coffee ($5) or help with server cost ($10)

Donate via Paypal Become our Patreon

Thank you for your support!

Follow Us on Twitter!